Download
1 / 43
440 likes | 829 Views
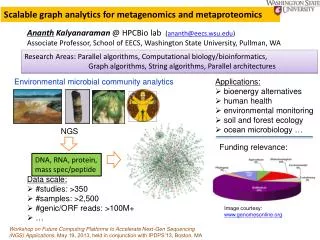
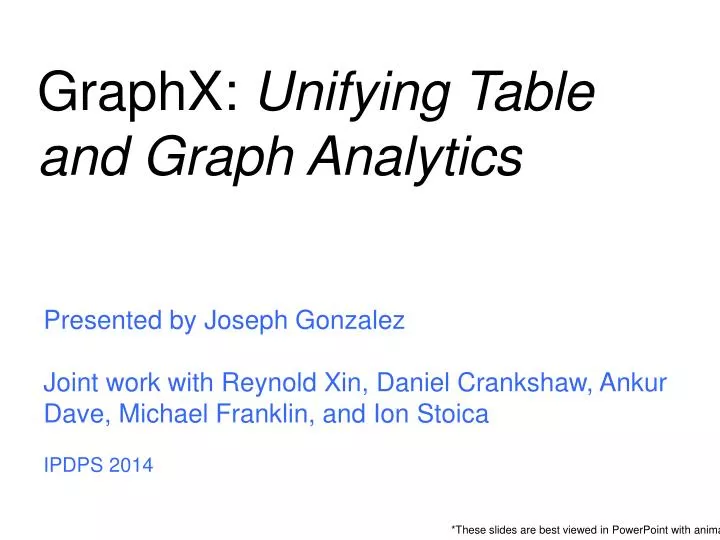
GraphX : Unifying Table and Graph Analytics. Presented by Joseph Gonzalez Joint work with Reynold Xin , Daniel Crankshaw , Ankur Dave, Michael Franklin, and Ion Stoica IPDPS 2014. *These slides are best viewed in P owerPoint with animation. Graphs are Central to Analytics. Hyperlinks.

E N D
GraphX: Unifying Table and Graph Analytics Presented by Joseph Gonzalez Joint work with ReynoldXin, Daniel Crankshaw, Ankur Dave, Michael Franklin, and Ion Stoica IPDPS 2014 *These slides are best viewed in PowerPoint with animation.
Graphs are Central to Analytics Hyperlinks PageRank Top 20 Pages Raw Wikipedia Text Table User User Title Title Word Topic PR Body Com. Topic Com. Disc. < / > < / > < / > Term-Doc Graph Topic Model (LDA) Word Topics XML Community Detection User Community Community Topic Discussion Table Editor Graph
PageRank: Identifying Leaders Update ranks in parallel Iterate until convergence Rank of user i Weighted sum of neighbors’ ranks
Recommending Products Low-Rank Matrix Factorization: f(j) f(i) f(3) r13 f(1) r14 x f(4) Iterate: Netflix ≈ Users Users r24 f(2) Movie Factors (M) User Factors (U) r25 f(5) Movies Movies
The Graph-Parallel Pattern Model / Alg. State Computation depends only on the neighbors
Many Graph-Parallel Algorithms MACHINE LEARNING SOCIAL NETWORK ANALYSIS • Collaborative Filtering • Alternating Least Squares • Stochastic Gradient Descent • Tensor Factorization • Structured Prediction • Loopy Belief Propagation • Max-Product Linear Programs • Gibbs Sampling • Semi-supervised ML • Graph SSL • CoEM • Community Detection • Triangle-Counting • K-core Decomposition • K-Truss • Graph Analytics • PageRank • Personalized PageRank • Shortest Path • Graph Coloring • Classification • Neural Networks GRAPH ALGORITHMS
Pregel Graph-Parallel Systems oogle Expose specialized APIs to simplify graph programming.
“Think like a Vertex.” - Pregel [SIGMOD’10]
The Pregel (Push) Abstraction Vertex-Programs interact by sending messages. Pregel_PageRank(i, messages) : // Receive all the messages total = 0 foreach( msg in messages) : total = total + msg // Update the rank of this vertex R[i] = 0.15 + total // Send new messages to neighbors foreach(j in out_neighbors[i]) : Send msg(R[i]) to vertex j i Malewiczet al. [PODC’09, SIGMOD’10]
The GraphLab (Pull) Abstraction Vertex Programs directly access adjacent vertices and edges R[4] * w41 GraphLab_PageRank(i) // Compute sum over neighbors total = 0 foreach( j in neighbors(i)): total = total + R[j] * wji // Update the PageRank R[i] = 0.15 + total + 4 1 R[2] * w21 R[3] * w31 + 3 2 Data movement is managed by the system and not the user.
IterativeBulk Synchronous Execution Compute Communicate Barrier
Pregel Graph-Parallel Systems oogle Expose specialized APIs to simplify graph programming. Exploit graph structure to achieve orders-of-magnitude performance gains over more general data-parallel systems.
PageRank on the Live-Journal Graph Spark is 4x fasterthan Hadoop GraphLab is 16x fasterthan Spark
Triangle Counting on Twitter 40M Users, 1.4 Billion Links Counted: 34.8 Billion Triangles Hadoop[WWW’11] 1536 Machines 423 Minutes 64 Machines 15 Seconds 1000 x Faster GraphLab S. Suri and S. Vassilvitskii, “Counting triangles and the curse of the last reducer,” WWW’11
Graph Analytics Pipeline Hyperlinks PageRank Top 20 Pages Raw Wikipedia Text Table User User Title Title Word Topic PR Body Com. Topic Com. Disc. < / > < / > < / > Term-Doc Graph Topic Model (LDA) Word Topics XML Community Detection User Community Community Topic Discussion Table Editor Graph
Tables Hyperlinks PageRank Top 20 Pages Raw Wikipedia Text Table User User Title Title Word Topic PR Body Com. Topic Com. Disc. < / > < / > < / > Term-Doc Graph Topic Model (LDA) Word Topics XML Community Detection User Community Community Topic Discussion Table Editor Graph
Graphs Hyperlinks PageRank Top 20 Pages Raw Wikipedia Text Table User User Title Title Word Topic PR Body Com. Topic Com. Disc. < / > < / > < / > Term-Doc Graph Topic Model (LDA) Word Topics XML Community Detection User Community Community Topic Discussion Table Editor Graph
Separate Systems to Support Each View Table View Graph View Table Dependency Graph Row Row Result Row Row Pregel
Having separate systems for each view is difficult to use and inefficient
Difficult to Program and Use Users must Learn, Deploy, and Managemultiple systems Leads to brittle and often complex interfaces
Inefficient Extensive data movement and duplication across the network and file system < / > < / > < / > XML HDFS HDFS HDFS HDFS Limited reuse internal data-structures across stages
GraphX Solution: Tables and Graphs are viewsof the same physical data GraphX Unified Representation Table View Graph View Each view has its own operators that exploit the semantics of the view to achieve efficient execution
Graphs Relational Algebra • Encode graphs as distributed tables • Express graph computation in relational algebra • Recast graph systems optimizations as: • Distributed join optimization • Incremental materialized maintenance Integrate Graph and Table data processing systems. Achieve performance parity with specialized systems.
Distributed Graphs as Distributed Tables Vertex Table Routing Table Property Graph Edge Table F A E D C B Part. 1 A C E E A B A A C E F D F D C B A B C A B B 1 A D C 1 1 2 2 A D C 1 2D Vertex Cut Heuristic A D D Part. 2 D F E E E 2 F F 2
Table Operators • Table operators are inherited from Spark: map filter groupBy sort union join leftOuterJoin rightOuterJoin reduce count fold reduceByKey groupByKey cogroup cross zip sample take first partitionBy mapWith pipe save ...
Graph Operators class Graph [ V, E ] { defGraph(vertices: Table[ (Id, V) ], edges: Table[ (Id, Id, E) ]) // Table Views ----------------- defvertices: Table[ (Id, V) ] defedges: Table[ (Id, Id, E) ] deftriplets: Table [ ((Id, V), (Id, V), E) ] // Transformations ------------------------------ defreverse: Graph[V, E] defsubgraph(pV: (Id, V) => Boolean, pE: Edge[V,E] => Boolean): Graph[V,E] defmapV(m: (Id, V) => T ): Graph[T,E] defmapE(m: Edge[V,E] => T ): Graph[V,T] // Joins ---------------------------------------- defjoinV(tbl: Table [(Id, T)]): Graph[(V, T), E ] defjoinE(tbl: Table [(Id, Id, T)]): Graph[V, (E,T)] // Computation ---------------------------------- defmrTriplets(mapF: (Edge[V,E]) => List[(Id, T)],reduceF: (T, T) => T): Graph[T, E] }
Triplets Join Vertices and Edges • The tripletsoperator joins vertices and edges: SELECT s.Id, d.Id, s.P, e.P, d.P FROM edges AS e JOIN vertices AS s, vertices AS d ON e.srcId = s.Id AND e.dstId = d.Id Vertices Triplets Edges B B C D A A A A C B B C A A C C C C D D B B The mrTripletsoperator sums adjacent triplets. SELECT t.dstId, reduce( map(t) ) AS sum FROM triplets AS t GROUPBYt.dstId
Example: Oldest Follower 23 42 B C • Calculate the number of older followers for each user? • valolderFollowerAge = graph .mrTriplets( e => // Map if(e.src.age < e.dst.age) { (e.srcId, 1) else { Empty } , (a,b) => a+ b // Reduce ) .vertices 30 A D E 19 75 F 16
We express enhancedPregel and GraphLababstractions using the GraphXoperatorsin less than 50 lines of code!
Enhanced Pregelin GraphX Require Message Combiners pregelPR(i, messageList ): messageSum // Receive all the messages total = 0 foreach( msg in messageList) : total = total + msg messageSum // Update the rank of this vertex R[i] = 0.15 + total combineMsg(a, b): // Compute sum of two messages return a + b Remove Message Computationfrom the Vertex Program // Send new messages to neighbors foreach(j in out_neighbors[i]) : Send msg(R[i]/E[i,j]) to vertex sendMsg(ij, R[i], R[j], E[i,j]): // Compute single message return msg(R[i]/E[i,j]) Malewiczet al. [PODC’09, SIGMOD’10]
PageRank in GraphX // Load and initialize the graph val graph = GraphBuilder.text(“hdfs://web.txt”) valprGraph = graph.joinVertices(graph.outDegrees) // Implement and Run PageRank valpageRank = prGraph.pregel(initialMessage = 0.0, iter= 10)( (oldV, msgSum) => 0.15 + 0.85 * msgSum, triplet => triplet.src.pr / triplet.src.deg, (msgA, msgB) =>msgA + msgB)
Join Elimination Identify and bypass joins for unused triplet fields sendMsg(ij, R[i], R[j], E[i,j]): // Compute single message return msg(R[i]/E[i,j]) Factor of 2 reduction in communication
We express the Pregel and GraphLablikeabstractions using the GraphXoperatorsin less than 50 lines of code! By composing these operators we canconstruct entire graph-analytics pipelines.
Example Analytics Pipeline • // Load raw data tables • valverts = sc.textFile(“hdfs://users.txt”).map(parserV) • val edges = sc.textFile(“hdfs://follow.txt”).map(parserE) • // Build the graph from tables and restrict to recent links • val graph = new Graph(verts, edges) • val recent = graph.subgraph(edge => edge.date > LAST_MONTH) • // Run PageRank Algorithm • valpr = graph.PageRank(tol = 1.0e-5) • // Extract and print the top 25 users • valtopUsers = verts.join(pr).top(25).collect • topUsers.foreach(u => println(u.name+‘\t’+u.pr))
The GraphX Stack(Lines of Code) SVD (40) LDA (120) PageRank (5) Connected Comp. (10) Shortest Path (10) ALS (40) K-core (51) Triangle Count (45) Pregel (28) + GraphLab (50) GraphX (3575) Spark
Performance Comparisons Live-Journal: 69 Million Edges GraphX is roughly 3x slower than GraphLab
GraphX scales to larger graphs Twitter Graph: 1.5 Billion Edges • GraphX is roughly 2x slower than GraphLab • Scala + Java overhead: Lambdas, GC time, … • No shared memory parallelism: 2x increase in comm.
A Small Pipeline in GraphX Raw Wikipedia Hyperlinks PageRank Top 20 Pages HDFS HDFS < / > < / > < / > Spark Preprocess Compute Spark Post. XML 605 375 Timed end-to-end GraphX is fasterthan GraphLab
Status • Part of Apache Spark • In production at several large technology companies
New API Blurs the distinction between Tables and Graphs New System Combines Data-Parallel Graph-Parallel Systems GraphX: Unified Analytics Enabling users to easily and efficiently express the entire graph analytics pipeline
A Case for Algebra in Graphs • A standard algebra is essential for graph systems: • e.g.: SQL proliferation of relational system • By embedding graphs in relational algebra: • Integration with tables and preprocessing • Leverage advances in relational systems • Graph opt. recast to relational systems opt.
Thanks! http://amplab.cs.berkeley.edu/projects/graphx/ ankurd@eecs.berkeley.edu crankshaw@eecs.berkeley.edu rxin@eecs.berkeley.edu jegonzal@eecs.berkeley.edu