Download
1 / 48
510 likes | 908 Views
GraphX : Unifying Data-Parallel and Graph-Parallel Analytics . Presented by Joseph Gonzalez Joint work with Reynold Xin , Daniel Crankshaw , Ankur Dave, Michael Franklin, and Ion Stoica Strata 2014. *These slides are best viewed in P owerPoint with animation.

E N D
GraphX:Unifying Data-Parallel and Graph-Parallel Analytics Presented by Joseph Gonzalez Joint work with ReynoldXin, Daniel Crankshaw, Ankur Dave, Michael Franklin, and Ion Stoica Strata 2014 *These slides are best viewed in PowerPoint with animation.
Graphs are Central to Analytics Hyperlinks PageRank Top 20 Pages Raw Wikipedia Text Table User User Title Title Word Topic PR Body Com. Topic Com. Disc. < / > < / > < / > Term-Doc Graph Topic Model (LDA) Word Topics XML Community Detection User Community Community Topic Discussion Table Editor Graph
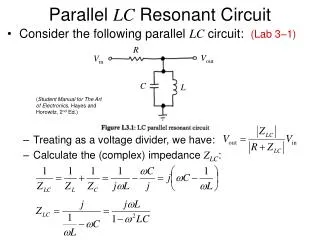
PageRank: Identifying Leaders Update ranks in parallel Iterate until convergence Rank of user i Weighted sum of neighbors’ ranks
The Graph-Parallel Pattern Model / Alg. State Computation depends only on the neighbors
Many Graph-Parallel Algorithms • Collaborative Filtering • Alternating Least Squares • Stochastic Gradient Descent • Tensor Factorization • Structured Prediction • Loopy Belief Propagation • Max-Product Linear Programs • Gibbs Sampling • Semi-supervised ML • Graph SSL • CoEM • Community Detection • Triangle-Counting • K-core Decomposition • K-Truss • Graph Analytics • PageRank • Personalized PageRank • Shortest Path • Graph Coloring • Classification • Neural Networks
Pregel Graph-Parallel Systems oogle Expose specialized APIs to simplify graph programming. Exploit graph structure to achieve orders-of-magnitude performance gains over more general data-parallel systems.
PageRank on the Live-Journal Graph GraphLab is 60x fasterthan Hadoop GraphLab is 16x fasterthan Spark
Graphs are Central to Analytics Hyperlinks PageRank Top 20 Pages Raw Wikipedia Text Table User User Title Title Word Topic PR Body Com. Topic Com. Disc. < / > < / > < / > Term-Doc Graph Topic Model (LDA) Word Topics XML Community Detection User Community Community Topic Discussion Table Editor Graph
Separate Systems to Support Each View Table View Graph View Table Dependency Graph Row Row Result Row Row Pregel
Having separate systems for each view is difficult to use and inefficient
Difficult to Program and Use Users must Learn, Deploy, and Managemultiple systems Leads to brittle and often complex interfaces
Inefficient Extensive data movement and duplication across the network and file system < / > < / > < / > XML HDFS HDFS HDFS HDFS Limited reuse internal data-structures across stages
New API Blurs the distinction between Tables and Graphs New System Combines Data-Parallel Graph-Parallel Systems Solution: The GraphX Unified Approach Enabling users to easily and efficiently express the entire graph analytics pipeline
Tables and Graphs are composableviewsof the same physical data GraphX Unified Representation Table View Graph View Each view has its own operators that exploit the semantics of the view to achieve efficient execution
View a Graph as a Table Property Graph Vertex Property Table R F Edge Property Table J I
Table Operators • Table (RDD) operators are inherited from Spark: map filter groupBy sort union join leftOuterJoin rightOuterJoin reduce count fold reduceByKey groupByKey cogroup cross zip sample take first partitionBy mapWith pipe save ...
Graph Operators class Graph [ V, E ] { defGraph(vertices: Table[ (Id, V) ], edges: Table[ (Id, Id, E) ]) // Table Views ----------------- defvertices: Table[ (Id, V) ] defedges: Table[ (Id, Id, E) ] deftriplets: Table [ ((Id, V), (Id, V), E) ] // Transformations ------------------------------ defreverse: Graph[V, E] defsubgraph(pV: (Id, V) => Boolean, pE: Edge[V,E] => Boolean): Graph[V,E] defmapV(m: (Id, V) => T ): Graph[T,E] defmapE(m: Edge[V,E] => T ): Graph[V,T] // Joins ---------------------------------------- defjoinV(tbl: Table [(Id, T)]): Graph[(V, T), E ] defjoinE(tbl: Table [(Id, Id, T)]): Graph[V, (E,T)] // Computation ---------------------------------- defmrTriplets(mapF: (Edge[V,E]) => List[(Id, T)],reduceF: (T, T) => T): Graph[T, E] }
Triplets Join Vertices and Edges • The tripletsoperator joins vertices and edges: Vertices Triplets Edges B C D B A C A B C A A B A A C C C D C B B D The mrTripletsoperator sums adjacent triplets. SELECT t.dstId, reduceUDF( mapUDF(t) ) AS sum FROM triplets AS t GROUPBYt.dstId
Map Reduce Triplets B C • Map-Reduce for each vertex • mapF( ) A1 A • mapF( ) A2 D E A A B C • reduceF( , ) A A1 A2 F
Example: Oldest Follower 23 42 B C • What is the age of the oldest follower for each user? • valoldestFollowerAge = graph .mrTriplets( e=> (e.dst.id, e.src.age),//Map (a,b)=> max(a, b) //Reduce ) .vertices 30 A D E 19 75 F 16
We express the Pregel and GraphLababstractions using the GraphXoperatorsin less than 50 lines of code! By composing these operators we canconstruct entire graph-analytics pipelines.
Distributed Graphs as Tables (RDDs) Vertex Table (RDD) Routing Table (RDD) Property Graph Edge Table (RDD) F A E D C B Part. 1 A C E E A B A A C E F D F D C B A B C A B B 1 A D C 1 1 2 2 A D C 1 2D Vertex Cut Heuristic A D D Part. 2 D F E E E 2 F F 2
Caching for Iterative mrTriplets Vertex Table (RDD) Edge Table (RDD) Mirror Cache A C E A A A E B E C F F B D D C A A A A A B B D B C C E C Mirror Cache D D D F D E E F F
Incremental Updates for Iterative mrTriplets Vertex Table (RDD) Edge Table (RDD) Mirror Cache A E E A C A A B C D F E B C D F A Change Change A A A A B B D C C E Mirror Cache D F D E Scan E F
Aggregation for Iterative mrTriplets Vertex Table (RDD) Edge Table (RDD) Mirror Cache B C E A A E A A C D E F F C D B A Change Change Change Change Change Change Local Aggregate A A B B C D B C C E Mirror Cache D F D Local Aggregate E Scan D F F
Reduction in Communication Due to Cached Updates Most vertices are within 8 hopsof all vertices in their comp.
Benefit of Indexing Active Edges Scan All Edges Index of “Active” Edges
Join Elimination Identify and bypass joins for unused triplets fields • Example: PageRank only accesses source attribute Factor of 2 reduction in communication
Additional Query Optimizations • Indexing and Bitmaps: • To accelerate joins across graphs • To efficiently construct sub-graphs • Substantial Index and Data Reuse: • Reuse routing tables across graphs and sub-graphs • Reuse edge adjacency information and indices
Performance Comparisons Live-Journal: 69 Million Edges GraphX is roughly 3x slower than GraphLab
GraphX scales to larger graphs Twitter Graph: 1.5 Billion Edges • GraphX is roughly 2x slower than GraphLab • Scala + Java overhead: Lambdas, GC time, … • No shared memory parallelism: 2x increase in comm.
A Small Pipeline in GraphX Raw Wikipedia Hyperlinks PageRank Top 20 Pages HDFS HDFS < / > < / > < / > Spark Preprocess Compute Spark Post. XML 605 375 Timed end-to-end GraphX is fasterthan GraphLab
The GraphX Stack(Lines of Code) SVD (40) LDA (120) PageRank (5) Connected Comp. (10) Shortest Path (10) ALS (40) K-core (51) Triangle Count (45) Pregel (28) + GraphLab (50) GraphX (3575) Spark
Status • Alpha release as part of Spark 0.9 • Seeking collaborators and feedback
Conclusion and Observations • Domain specific views: Tables and Graphs • tables and graphs are first-class composable objects • specialized operators which exploit view semantics • Single system that efficiently spans the pipeline • minimize data movement and duplication • eliminates need to learn and manage multiple systems • Graphs through the lens of database systems • Graph-Parallel Pattern Triplet joins in relational alg. • Graph Systems Distributed join optimizations
Active Research • Static Data Dynamic Data • Apply GraphX unified approach to time evolving data • Model and analyze relationships over time • Serving Graph Structured Data • Allow external systems to interact with GraphX • Unify distributed graph databases with relational database technology
Thanks! http://amplab.github.io/graphx/ ankurd@eecs.berkeley.edu crankshaw@eecs.berkeley.edu rxin@eecs.berkeley.edu jegonzal@eecs.berkeley.edu
Graph Property 1Real-World Graphs Power-Law Degree Distribution Edges >> Vertices AltaVista WebGraph1.4B Vertices, 6.6B Edges -Slope = α≈ 2 Top 1% of vertices are adjacent to 50% of the edges! Number of Vertices More than 108 vertices have one neighbor. Degree
Graph Property 2Active Vertices PageRank on Web Graph 51% updated only once!
Graphs are Essential to Data Mining and Machine Learning • Identify influential people and information • Find communities • Understand people’s shared interests • Model complex data dependencies
Recommending Products Users Items Ratings
Recommending Products Low-Rank Matrix Factorization: f(j) f(i) f(3) r13 f(1) r14 x f(4) Iterate: Netflix ≈ Users Users r24 f(2) Movie Factors (M) User Factors (U) r25 f(5) Movies Movies
Predicting User Behavior ? ? Liberal Conservative ? ? ? ? ? ? ? ? ? Post ? Post Post Post ? Post Post Post Post ? Post Post Post Post ? ? ? Post ? Post ? ? ? Post ? Post Post Post Post Conditional Random Field Belief Propagation Post Post Post ? ? ? ? ? ? ? ?
Finding Communities • Count triangles passing through each vertex: • Measures “cohesiveness” of local community 1 3 2 4 Fewer Triangles Weaker Community More Triangles Stronger Community
Example Graph Analytics Pipeline Preprocessing Compute Post Proc. < / > < / > < / > XML Raw Data ETL Analyze Slice Compute Initial Graph Subgraph PageRank Top Users • Repeat