Download
1 / 42
420 likes | 437 Views
Metro Customer Satisfaction Survey Westside/Central Sector Results (Bus) 2002-2005. Semi-annual on-board customer satisfaction survey. A sample of all directly-operated Metro Bus lines surveyed between 5 am – 8 pm on weekdays. About 15,000 surveys returned with a 60% response rate.

E N D
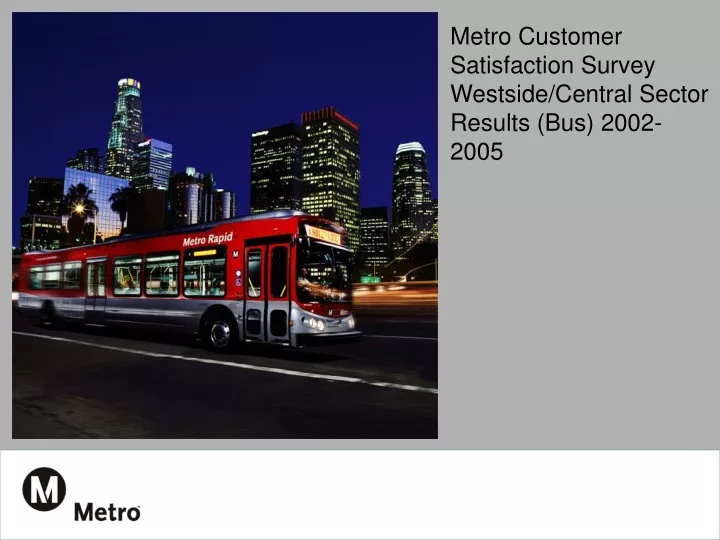
Metro Customer Satisfaction SurveyWestside/Central Sector Results (Bus) 2002-2005
Semi-annual on-board customer satisfaction survey.A sample of all directly-operated Metro Bus lines surveyed between 5 am – 8 pm on weekdays.About 15,000 surveys returned with a 60% response rate. Survey Methodology
Customer satisfaction continues to be high.Perception of on-time performance and cleanliness increasingly positive.Passbys at an all-time low while more people have a seat on their bus.Customers feel safe and think service is convenient. Results for Fall 2005
More Than 4 out of 5 Customers Think Metro’s Image is Improving
Customers Overwhelmingly Find Metro Service Convenient to Use
Metro Orange Line Survey Submitted by: Applied Management and Planning Group 12300 Wilshire Boulevard Suite 430 Los Angeles, California 90025
Results • Boarding and alighting patterns suggest the Orange Line acts as an extension of the Red Line. • Over 50% of all Orange Line riders previously took a Metro Bus before the Orange Line opened, and 18% either drove alone or carpooled. • About 8 in 10 (79%) of the riders who previously drove alone or carpooled used the 101 freeway. • Of the former 101 Freeway drivers, 77% indicated their trip time has been reduced.
Access Mode – All Respondents The majority of riders either walk to a local station or connect via Metro bus. About 13% of respondents drive to the local station, park and ride.
Egress Mode – All Respondents About 50% of respondents indicate that they will either connect to a Metro Bus or Rail line to complete their trip.
Pre-Orange Line Modes of Transportation – All Respondents 18% of respondents indicated that they drove alone or carpooled to make their trip prior to the Orange Line opening.
101 Freeway Usage – All Respondents Overall, 79% of Orange Line riders who indicated that they drove alone or carpooled prior to the Orange Line opening, used the 101 Freeway to complete their trip.
Availability of Personal Transportation – All Respondents Over a third of all respondents (36%) indicated that they had a car available to complete their trip.
Experience Riding Metro – All Respondents Overall, 31% of Orange Line passengers are either “new riders”(17%) or are riders who have used Metro for less than a year (14%). The majority of Orange Line riders have been Metro customers for five years or more.
Trip Purpose(s) – All Respondents Of those who indicated the purpose of their trip, 41% indicated that they were using the Orange Line as a to/from work commuter line. Thirty-one percent indicated that they use the line to travel from their home to another location (medical, shopping, recreation).
Travel Time – All Respondents Of those who indicated that they took their trip prior to the Orange Line opening, 85% stated that the Orange Line has cut their travel time.
Other Service Features – All Respondents Over 90% of all respondents indicated that they normally have a seat for their trip, like the Metroliner vehicle and the Orange Lines’ pre-paid boarding system. n=1201 n=1116 n=1123