Download
1 / 24
400 likes | 1.16k Views
Customer Satisfaction Profit Chain. Prof. Markus Christen INSEAD Singapore May/June 2007. Customer Satisfaction Is Decreasing. American Customer Satisfaction Index (ASCI) Based on annual poll of more than 50.000 consumes, measuring overall satisfaction with products and services.

E N D
Customer Satisfaction Profit Chain Prof. Markus Christen INSEAD SingaporeMay/June 2007
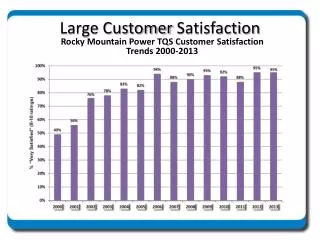
Customer Satisfaction Is Decreasing American Customer Satisfaction Index (ASCI) Based on annual poll of more than 50.000 consumes,measuring overall satisfaction with products and services. Source: http://www.theacsi.org, University of Michigan
CRM Investments Approximate Worldwide CRM Investments (applications, hardware and services)
Starbucks: Delivering Customer Service • Why successful • Tight alignment between target market (sophisticated, affluent coffee lover, coffee drinking life style) and highly differentiated value proposition • Drinking coffee as self-indulgent ritual: Best coffee • Tendency to linger, in search of a sanctuary: Physical environment • Friendly people, social interactions: Service Philosophy • Impact of growth strategy • Retail expansion: Ubiquity of stores makes Starbucks less “special” • Customer acquisition: New customers with different service needs • Routine • Pass through • Convenience • Product innovation: Increased production complexity leads to longer lines
Starbucks: Delivering Customer Service • Consequence • Conflicts between customer segments affects service quality • Longer lines, more mistakes, less time to interact and socialize • Grumpy customers, grumpy employees • Difficult to keep customer satisfaction very high with a larger and more diverse customer base • What are the appropriate metrics to manage different customers or customer segments? Customer acquisition and retention?
Product Performance Customer Satisfaction Retention / Loyalty Revenue / Profit Service Performance Employee Performance Satisfaction-Profit-Chain (SPC)
Satisfaction and Customer Behavior Correlations for 418 customers of European paper wholesaler Source: Söderlund, Vilgon & Gunnarsson 2001, European Journal of Marketing
Zone of indifference Customer Satisfaction and Loyalty Source: Jones & Sasser, HBR, Nov/Dec. 1995
Satisfaction and Performance Estimated impact of a one-unit change in customer satisfaction (ACSI) on the market value of equity (millions of dollars) Source: Ittner and Larcker, Journal of Accounting Research
-Cost, -Revenues, -Profits AssociatedCost AssociatedRevenues Product/ServiceImprovements OptimalLevel AssociatedProfits More Satisfaction Is Not Always Better
Price Premium Referrals ReducedOperating Costs IncreasedPurchases Base Profits 1 2 3 4 5 6 Years Cost of Acquisition Source: F. Reichheld & T.A. Teal (1996), The Loyalty Effect. Loyalty and Performance • Why are loyal customers more profitable? • They buy more (revenues) • They are less costly to serve (cost) • They pay higher prices • They generate more Word-of-mouth
Loyalty and Performance Butterflies True friends Strangers Barnacles Source: Reinartz and Kumar (2002), HBR, July.
Loyalty and Performance Do Profits Increase over Time?
The Relationship Continuum Transactional Orientation (Commodity) ProcurementOrientation (Deliver value added products and services) RelationalOrientation (Partnership) • Discrete transactions • Adversarial relationship • Focus on price • Multisourcing to exert power • Global sourcing • Repeat transactions • Reduction in suppliers • Integrative negotiations (not only price) • Goal of cost reduction and quality improvement through coordination • More cooperative relationships with the goal of pie expansion • Both parties focus on generating value forend-user • Buyer focuses on core competence; strategically outsources remaining activities • Highly collaborative deep, relationships with select suppliers (typically sole-source relationships) Very high competitive pressure Achieve competitive advantage
Calculating Current Customer Value Revenues (A) -direct cost = Gross margin (B) -cost-to-serve(marketing, sales, terms and conditions, support, returns, etc.) = Contribution margin (C) -fixed cost = Operating margin (EBITDA) All on a per-customer basis! Does not include intangibles (word-of-mouth, reference effects)
Tangible value metrics Current value Revenues Gross margin Cost-to-serve Contribution margin Share-of-wallet Potential value Size-of-wallet Lifetime value Non-tangible value metrics Current value Reference value Referral value Cooperation value (e.g., shared intelligence) Potential value Future value Key Metric: Customer Value
Customer Value Concentration Brazilian Grocery Store
Customer Value Concentration US Pharmaceutical Firm
Customer Value Analysis • Objective: The result of the analysis should allow to evaluate the following: • Value level • Average value over all customers • Value disparity • Difference Highest – Lowest value • Ratio of 90th percentile /10th percentile (if > 15 then high disparity) • Value concentration (heterogeneity) • 80/20 rule (80% of contribution come from x% of customers) • Gini Coefficient (> 80% = high concentration) • All analyses to be done • Across all customers • On segment level (geography, business line, etc)
Personnel 8.99 Stated Sales Loyalty 8.76 Insurance Models 8.50 0.314 0.410 0.023 Financing 0.087 Profit New Car Stated Sales Satisfaction 8.73 Information 8.48 -0.055 0.168 0.035 Volvo Card 0.115 0.094 Delivery 8.68 0.492 0.072 Workshop Loyalty Car Satisfaction 9.26 Source: Johnson and Gustafsson Jossey-Bass, 2000 Putting It All Together Sales Satisfaction Model forLoyal Volvo Customers
Summary • S-P chain is a powerful concept for guiding customer-level actions • Its all about optimal satisfaction and optimal retention levels • Need for careful application to own environment • Necessitates “correct” measures and operationalizations • Forces to explore causal linkages • Sheds light on correct metrics
Summary • Looking at value to and from customers • Provides focus: target only potentially profitable customers • Think about what drives customer value (to the firm) • Enables resource allocation that is fair from a customer perspective and makes business sense economically • CRM is the strategic process of selecting the customers a firm can most profitably serve and shaping the interactions between a company and these customers. • Ultimate goal: Improve marketing decision-making and resource allocation
Rule 10: Customer Value Not all happy customersare loyal customers andnot all loyal customersare worth keeping: Measure & managecustomer profitability