Download

1 / 12
120 likes | 120 Views
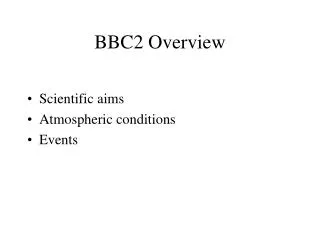
This study analyzes the SPUV aerosol data from the May 2003 BBC2 campaign, focusing on aerosol optical thickness and Angstrom parameter variations throughout the month. Findings suggest strong diurnal variations and the need for intercomparison with CIMEL aerosol data.

E N D
Analysis of SPUV aerosol data for the May 2003 BBC2 campaign Piet Stammes Wouter Knap KNMI
The SPUV sunphotometer has 6 spectral channels: 368 nm 501 nm 675 nm 780 nm 871 nm 940 nm (H2O) These channels are 2-15 nm wide.
Data description • SPUV data available for all days of May 2003, except 22 May. • Data are 1-minute values of aerosol optical thickness at 368, 501, 675, 780 and 871 nm. • AOT spectral dependence is characterized by the Angstrom relation: AOT () -
Data processing 1. Absolute calibration uses the De Bilt time-series (June 1997- March 2003) and the Jungfraujoch calibration campaign (Aug.-Nov. 2003). 2. Correction for Rayleigh scattering and ozone absorption uses actual data of surface pressure and ozone column. 3. Cloud detection is improved: repeated triplet test. 4. Only days with >2 % cloud-free points for the 501 nm channel are considered.
Percentage cloud-free points Morning values Afternoon values NB: - Not many cloud-free days during the flights between 8 and 21 May - Clear period end of the month - More cloud-free points in the morning than in the afternoon.
AOT at 501 nm Morning averages ± Afternoon averages ± NB: - lower AOT values until 15-20 May, higher values at end of month - PM data lower than AM data in first half of the month.
Angstrom parameter Morning averages ± Afternoon averages ± NB: - lower values until 15-20 May, higher values at end of month - high values of Angstrom parameter at end of the month. - low AOT, large particles in first half of month - high AOT, small particles at end of month
Examples of daily variation in aerosol on three days:4 May, 8 May and 31 May 2003
Diurnal variation of aerosol on 4 May 2003 AOT at 501 nm Angstrom parameter
Diurnal variation of aerosol on 8 May 2003 AOT at 501 nm Angstrom parameter
Diurnal variation of aerosol on 31 May 2003 AOT at 501 nm Angstrom parameter Number of channels to fit AOT () to - varies over the day; this changes .
Conclusions • Aerosol optical thickness can vary strongly over the day, probably due to advection and turbulence. • The BBC2 days with aircraft data are not well suited for aerosol studies. • Future work: - Intercomparison with CIMEL aerosol data - Combine with the broadband irradiances at the ground to determine the direct aerosol effect.