Download
1 / 48
510 likes | 842 Views
Satellite inputs for smoke emissions and aerosol data assimilation in the Navy Aerosol Analysis and Prediction System . Edward Hyer NRL Aerosol & Radiation Group May 19, 2011. In This Talk. Navy aerosol applications, NRL aerosol R&D

E N D
Satellite inputs for smoke emissions and aerosol data assimilation in the Navy Aerosol Analysis and Prediction System Edward Hyer NRL Aerosol & Radiation Group May 19, 2011 Hyer @ NOAA
In This Talk • Navy aerosol applications, NRL aerosol R&D • NAVDAS-AOD: Generation of assimilation-friendly satellite AOD products • Quality issues in MODIS AOD • Pre-processing steps taken for NAVDAS-AOD • Results of QA/QC • Availability of products and future plans • FLAMBE: Accounting for fire detection efficiency for smoke source estimation • MODIS sensor properties and fire time series • Development of correction for MODIS scan effects • Results of correction, next steps Hyer @ NOAA
Lingo: FLAMBE, NAAPS, and NAVDAS-AOD • FLAMBE: Fire Locating and Monitoring of Burning Emissions • NAAPS: Navy Aerosol Analysis and Prediction System • NAVDAS-AOD:Navy Variational Data Assimilation System for Aerosol Optical Depth • WF_ABBA: Wildfire Automated Biomass Burning Algorithm (Wisconsin-CIMSS) Hyer @ NOAA
Capabilities in Place at NRL • Fire Monitoring from satellite • GOES data within 2 hours • MODIS data within 6 hours • Smoke source estimation • Hourly emissions • Spatial resolution of input data (<5km) • Available for global and mesoscale simulations • Aerosol transport and evolution modeling • analysis + 72-hour forecast every 24 hours • Aerosol Optical Depth (AOD) Data Assimilation • Over ocean operational at FNMOC • Over-land tested at NRL Hyer @ NOAA
Applied Research in the NRL Aerosol Forecasting Group We work end-to-end, from source functions… FLAMBE smoke source function (Reid et al. JSTARS 2009) Satellite spatial resolution and emissions error (Hyer and Reid, GRL 2009) Dust source database for mesoscale forecasting (Walker et al., JGR 2009) …to data assimilation… Development of corrected global over-land AOD product from MODIS (Hyer et al., AMT 2011) AOD data assimilation for global model (Zhang et al., JGR 2008) Calculation of extinction for assimilation of CALIOP data (Campbell, et al., JSTARS 2009) Assimilation of CALIOP lidar data (Zhang et al., GRL, in review) …to modeling of transport and sinks… Effects of modeled vs. satellite precip on wet deposition (Xian et al., GRL 2009) …to evaluation of model performance with PM data… Evaluation of NAAPS model for large smoke events in SE Asia 2006 (Hyer and Chew, Atm. Env., 2010) …we even examine the phenomenology of AERONET Sunphotometer data Examination of subvisible cirrus in AERONET retrievals using LIDAR (Chew et al., JGR in review) Our end-to-end approach helps us prioritize scientific problems and place them in context Our research focus is continually informed by the needs of our operational customer We rely on innovations from the scientific community, and we are committed to giving back Hyer @ NOAA
Part I:AOD for data assimilation based on MODIS MOD04 Hyer @ NOAA
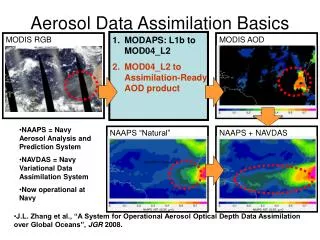
MODIS RGB MODIS AOD NAAPS “Natural” NAVDAS-AOD Data Assimilation • J.L. Zhang et al., “A System for Operational Aerosol Optical Depth Data Assimilation over Global Oceans”, JGR 2008. • Operational at FNMOC from September 2009 • Over-land is being prepared for transition in FY11 NAAPS + NAVDAS Hyer @ NOAA
Objectives of QA/QC of satellite AOD for data assimilation • Minimize outliers • “a few good obs” • Reduce bias • Offsets • Slopes • Quantify residual uncertainty • For each ob: as much detail as possible • Minimize outliers Hyer @ NOAA
The basics of aerosol retrieval from VIS/NIR radiance C&I=SIGNAL • Aerosol “signal” = • Implications: • Aerosol scattering (C+I) retrieved simultaneously with surface reflectance (A) A&G ≠ SIGNAL C=SIGNAL Schott, 1997, Figure 3.1 Hyer @ NOAA
Identify & quantify uncertaintiesin collection 5 over ocean MODIS AOD Ocean Wind speed (m/s) MODIS detected cloud (%) Collection 5 Zhang and Reid, JGR 2006 Zhang et al., GRL 2005 Collection 4 0 5 10 15 Wind speed (m/s) • Wind speed -> whitecap lifting -> brighter surface -> positive bias in satellite AOD • This will be corrected in MODIS Collection 6 (NCEP winds) • Cloud is hard to remove 100%: Cloud can occupy any fraction of pixel • Residual cloud -> increased radiance -> positive bias in satellite AOD Hyer @ NOAA
Results of QC and QA of collection 5 over ocean MODIS AOD • Biases due to lower boundary condition still exist • Biases due to cloud contamination and cloud artifacts still exist • 20% reduction in absolute errors a) Terra+Aqua MODIS AOD (Level 3 daily average), before QA and QC, Jan. – Dec. 2006 b) Terra+Aqua MODIS AOD (Level 3 daily average), after QA and QC, Jan. – Dec. 2006 Zhang and Reid, JGR 2006 Hyer @ NOAA
Results of QC and QA of collection 5 over ocean MODIS AOD a) Terra+Aqua MODIS AOD, before QA and QC, Jan 2007 b) Aqua MODIS AOD, Jan 2007 [Vaughan et al. 2007] c) Terra+Aqua MODIS AOD, After QA and QC, Jan 2007 d) CALIPSOAOD, Jan 2007 [Vaughan et al. 2007] Hyer @ NOAA Figures b and d are from Mark Vaughan and co-authors, CALIPSO Aerosol Backscatter and Extinction Characterization Using the MODIS and OMI Products, Eos Trans. AGU, 88(52), Fall Meet. Suppl., Abstract A23A-0882 .
What’s so hard about AOD retrieval over land? C=SIGNAL • Aerosol “signal” = • Higher surface reflectance: • directly reduces this signal by increasing LOBS • places greater demands on model (LEST) A&G ≠ SIGNAL C=SIGNAL Schott, 1997, Figure 3.1 Hyer @ NOAA
AERONET L2.0 2005-2008 550nm AOD by quadratic interpolation (O’Neill et al. 2003) MOD04 Level 2, c5 550nm Corrected Optical Thickness + LOTS of metadata Matched ±30km, ±30minutes 4.1m retrieval pairs Metrics Mean Bias 25th & 75th percentile bias Target error: MOD43 Albedo 0.05° nearest neighbor black-sky hemispheric albedo Details of MODIS-AERONET comparison Hyer, Zhang and Reid, AMT 2011 Hyer @ NOAA
Signal-to-Noise 1: Path Length 74% 68% 53% • Atmospheric path length affects precision of AOD retrieval • Implications for comparing MODIS to CALIPSO & CloudSat • For high AOD, representativeness error cancels this effect Hyer @ NOAA
Signal-to-Noise 2: scattering angle For scattering angle <100°, compliance is 84% As scattering angle increases: • shadowing decreases • scene brightness increases • signal/noise drops • Because increase is more in VIS than NIR, correction is necessary • MODIS c5 correction works well for most scattering angles Hyer @ NOAA
41% Signal-to-Noise 2: scattering angle As scattering angle increases: • shadowing decreases • scene brightness increases • signal/noise drops • Because increase is more in VIS than NIR, correction is necessary • MODIS c5 correction works well for most scattering angles Hyer @ NOAA
Signal-to-Noise 2: scattering angle img: Harwood Forest, UK • This doesn’t affect much MODIS data: • 0.7% of AOD retrievals • 0.4% of ‘Very Good’ 41% Shadow of camera platform Backscatter hot spot (no shadows) see Vermote & Roy, IJRS 23(11):2141-2143 Hyer @ NOAA
Cloud Slide Cloudy retrievals are persistently biased vis-à-vis cloud-free retrievals. Silver lining: Cloud-free areas make up 84% of all retrieved AOD and 90% of ‘Very Good’ AOD. NRL product includes textural filters to reduce residual cloud. Hyer @ NOAA
MODIS Mandatory QA: Use Them, Love Them NRL product includes only QA=Very Good Hyer @ NOAA
Surface Boundary Condition Issues in over-land MODIS AOD • Strong systematic bias with surface albedo • Positive or negative biases for different land areas Hyer @ NOAA
Surface Boundary Condition Issues in over-land MODIS AOD • Albedo correction calculated empirically • Corrects negative bias in S. America, positive bias over arid surfaces Correction reduces occurrence of negative AODs AFTER CORRECTION Hyer @ NOAA
Surface Boundary Condition Issues in over-land MODIS AOD • Good compliance without albedo correction • Good compliance with albedo correction • Not recommended, even with correction • SW CONUS • Central China • Correction expands usable area of MODIS AOD • More to do: AOD still not available everywhere Hyer @ NOAA
Microphysical bias S. AMERICA N. AFRICA CORRELATION Vs. AERONET SLOPE vs AERONET Regional slope correction improves global correlation of MODIS AOD vs AERONET from r2=0.62-0.65 to r2=0.71-0.73 • MODIS c5 uses a coarse climatology of aerosol optical properties • Two problems: • Bias over regions • Uncaptured variability • Above: Bias has general regional trends • Below: High correlation + variable bias = uncaptured variability in aerosol properties • Result: NRL L3 product has a regional correction applied Hyer @ NOAA
Obs. Uncertainty = instrument error + representativeness error Representativeness error = SD of AOD within grid cell Instrument error: Over ocean: f(AOD, fine mode fraction) Over land: f(AOD, region) Error = MAX(“noise floor”,linear relation) Below left: Estimated uncertainty for over-land product without corrections QA=Very Good, Cloud =0 Below right: Error ratio of corrected vs. uncorrected AOD Australia: filtering changes distribution of AOD, increases noise floor error Error Estimation Hyer @ NOAA
Products now available on GODAE http://usgodae.org/cgi-bin/datalist.pl?Data_Type=ALL&Parameter=ALL&Provider=nrl&meta=Go#nrl_modis_l3 Access via FTP/HTTP Documentation 1 degree products in 6-hour increments Latency 24 hours Can retrieve land/ocean, Aqua/Terra separately Currently staged 2010-present Hyer @ NOAA
Products now available on GODAE http://usgodae.org/cgi-bin/datalist.pl?Data_Type=ALL&Parameter=ALL&Provider=nrl&meta=Go#nrl_modis_l3 • What’s Next • 0.5-degree product • currently in testing • Revisions to prognostic error model • Publish test results of prognostic error model • Use methods to evaluate NOAA ACSPO AVHRR AOD product • Proceed into VIIRS era Access via FTP/HTTP Documentation 1 degree products in 6-hour increments Latency 24 hours Can retrieve land/ocean, Aqua/Terra separately Currently staged 2010-present Hyer @ NOAA
Part II:Detection Efficiency Framework for FLAMBE fire detection Hyer @ NOAA
Conclusions Up Front • Variability in fire observations is the sum of • Variability in fire activity • Variability in observation conditions / detection efficiency • Correction for detection efficiency requires detection opportunity framework • Fire detections per area sensed • Angular variation in detection efficiency can be quantified and corrected • Correction improves correlation of daily fire time series • Does not solve everything Hyer @ NOAA
Variability in Fire vs. Variability in Observations CLIMATE AQ Forecasting Q: Do Terra and Aqua seem the same patterns of fire activity? A: Yes, at sufficiently coarse scales At temporal scales smaller than the orbital period, variations in MODIS detection reduce correlation At finer spatial scales, variations in fire behavior assert themselves At scales relevant for AQ forecasting, Terra and Aqua see different fires Hyer @ NOAA
Can these results be improved at finer scales? MODIS is the only option at high latitudes and in Central Asia MODIS has the best capability to detect small fires MODIS detection efficiency has been shown to vary across the scan Modeling and correcting this variation could improve AQ modeling results Hyer @ NOAA
A closer look at daily fire data from MODIS NASA Blue Marble + WF_ABBA SEVIRI fire detects • Example area in Southern Africa (Angola) • ~300km square • ~40k MODIS fires in 2010 • 200k in 2005-2010 • Mostly June-August Hyer @ NOAA
What’s Driving Daily Variation in MODIS fires? AQUA TERRA SEVIRI • MODIS Fire activity shows extreme daily variability not reflected in GEO • Fire activity shows strong periodicity with MODIS orbit (16 days) Hyer @ NOAA
What’s Driving Daily Variation in MODIS fires? AQUA TERRA SEVIRI • MODIS Fire activity shows extreme daily variability not reflected in GEO • Fire activity shows strong periodicity with MODIS orbit (16 days) • MODIS Lag correlation statistics show mainly the orbital periodicity • SEVIRI lag correlation shows the consistent nature of burning in this area 16 days Hyer @ NOAA
What’s Driving Daily Variation in MODIS fires? • MODIS-Observed fire activity (Aqua, top) is strongly related to view geometry (bottom) Hyer @ NOAA
Is angular dependence evident in the raw fire counts? • Fire counts do not show a strong relationship to view angle Hyer @ NOAA
What if we normalize by pixel counts? • Fire counts do not show a strong relationship to view angle • Counts per pixel show even less relationship Hyer @ NOAA
What if we normalize by area sensed? • Fire counts do not show a strong relationship to view angle • Counts per pixel show even less relationship • Counts per area sensed show a strong relationship Hyer @ NOAA
How robust is this relationship? • Solid lines: Calculated using 4 years 2007-2010 • Shaded area = range of single-year estimates • Angular dependence, and differences between Terra and Aqua, are very robust AQUA TERRA • Dashed lines show results from single years 2007-2010 • Shaded areas indicate range of single-year results Hyer @ NOAA
Can we construct an angular correction for fire counts? • Aqua correction is fairly symmetrical • Terra correction is extreme for the early side of the scan • 0945 to 1055 local time is a steep part of diurnal curve • For our initial correction, we use the noon-ward part of this curve • Also, we will correct for pixel overlap at scan edge AQUA TERRA • Dashed lines show results from single years 2007-2010 • Shaded areas indicate range of single-year results • Correction numbers include correction for pixel overlap Hyer @ NOAA
How would correction affect the time series? RAW RAW: R(TA)=0.64 R(TG)=0.71 R(AG)=0.77 AQUA TERRA SEVIRI t CORRECTED CORRECTED: R(TA)=0.73 R(TG)=0.77 R(AG)=0.88 Hyer @ NOAA
What does the corrected lag correlation look like? RAW AQUA TERRA SEVIRI • Correction makes lag correlation decay more like GEO • Variation with orbital period not completely eliminated CORRECTED Hyer @ NOAA
What about for 2010 fires in Northern Territory? RAW AQUA TERRA MTSAT RAW: R(TA)=0.51 R(TG)=0.37 R(AG)=0.49 t CORRECTED CORRECTED: R(TA)=0.75 R(TG)=0.42 R(AG)=0.53 Hyer @ NOAA
What about for 2010 fires in Northern Territory? AQUA TERRA MTSAT R(TA)=0.51 R(TG)=0.37 R(AG)=0.49 t R(TA)=0.75 R(TG)=0.42 R(AG)=0.53 Asymmetric correction: R(TA)=0.66 R(TG)=0.41 R(AG)=0.53 MTSAT and Terra steady, Aqua Way Down! What happened? Hyer @ NOAA
What about for 2010 fires in Northern Territory? AQUA TERRA SEVIRI R(TA)=0.51 R(TG)=0.37 R(AG)=0.49 June 19, 2010 t R(TA)=0.75 R(TG)=0.42 R(AG)=0.53 Asymmetric correction: R(TA)=0.66 R(TG)=0.41 R(AG)=0.53 SEVIRI and Terra steady, Aqua Way Down! What happened? Hyer @ NOAA
How does correction affect global correlations? BEFORE AFTER Positive impact on daily data at global model scales Small negative impact at some broader scales No effect at fine scales Hyer @ NOAA
Summary of Results • By accounting for area sensed = fire detection opportunity, we have calculated a quantitative correction for angular variation in MODIS fire detection efficiency • Correction improves time series correlations vs GEO • Correction results in more realistic lag correlations of regional fire activity • Correction improves global correlations of fire activity patterns • This correction has limitations • No improvement at fine spatial scales (won’t help simulations of individual fires) • Convolved with diurnal cycle Hyer @ NOAA
THANK YOU! Funding: ONR Code 32, NASA NRL Aerosol Group MODIS fire and aerosol products teams CIMSS WF_ABBA group Gracious Audience! Hyer @ NOAA