Download
1 / 28
280 likes | 336 Views
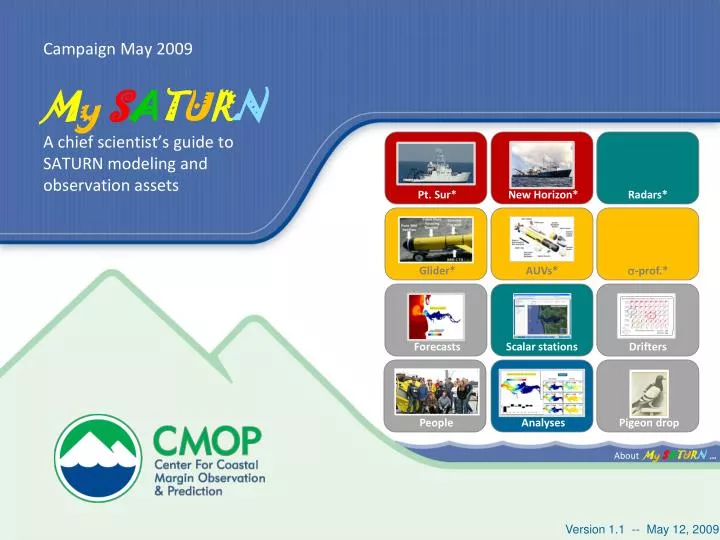
Campaign May 2009. M y S A T U R N A chief scientist’s guide to SATURN modeling and observation assets. Pt. Sur*. New Horizon*. Radars*. Glider*. AUVs*. -prof.*. Forecasts. Scalar stations. Drifters. People. Analyses. Pigeon drop. About M y S A T U R N ….

E N D
Campaign May 2009 MySATURN A chief scientist’s guide to SATURN modeling and observation assets Pt. Sur* New Horizon* Radars* Glider* AUVs* -prof.* Forecasts Scalar stations Drifters People Analyses Pigeon drop AboutMySATURN … Version 1.1 -- May 12, 2009
About navigation … Returns you to slide you were previously at Returns you to a second-level slide Outline slide Click on box with feature of interest, to access a first-level slide (note: many boxes still in preparation). From there, you can navigate to 2nd and then 3rd level slides Third level slide Many images are clickable. Pass mouse over images to check if that is the case Returns you to a first-level slide (if you are not at one already) MySATURN Returns you to outline slide
New Horizon Always remember that custom products can be created upon request • May 13 • Standard products showing surface velocities and salinities can be found at the fdb21 (best estuary model right now) RDFS site • Also useful may be the model browser. In particular, using the ibutton will produce salinity, temperature and speed plots at a given point • Zoom into the estuary • In the model forecast option select “db21 forecast” • Turn off all data (scalar and vector – on the left side) • Turn on db16 bathymetry in the overlay selector (under the Legend) to see the channel • Click the ibutton, then select a location in the channel • View salt, temp, vel depth data at that point in the Model Profile Data Interface • A pigeon drop directory containing some of these products is also available. • Be aware of the forecast schedule: each day a 3 day model run is completed. The 3 days are yesterday, today and tomorrow. For example: to see the plume on May 13 use the last day of the May 12 forecast until the May 13 forecast completes. • I’m assuming you’ll have internet access inside the estuary. If its intermittent and you’d like me to prepare some products for the next time you’re in range let me know and I’ll put it in the pigeon drop directory. -Nate
Pt. Sur Always remember that custom products can be created upon request • May 13-19 • Plume location can be found using the cruise mapper. If you have consistent internet access this is a good choice. Use the “dev” forecast. Charles or Alex will be able to guide you. • A simpler alternative/supplement is to use the plume animations from RDFS uploaded to the pigeon drop location. • We will expect to receive dye release locations from Pt Sur. We will then run drifter tracks and dye tracer runs and place them in the pigeon drop directory. • Be aware of the forecast schedule: each day a 3 day model run is completed. The 3 days are yesterday, today and tomorrow. For example: to see the plume on May 13 use the last day of the May 12 forecast until the May 13 forecast completes.
Particle Tracking Tools • Images are created using a single Matlab function, invoked on the fcast00 server (requires that access be setup) • We currently have three modes of particle tracking available • Pathway prediction • Release points evaluation • Release transect evaluation • Pathway prediction option produces a figure and a text file detailing predicted position/time of the drifter • Release position evaluation shows the predicted pathways for several release positions and times • Release transect evaluation shows the predicted pathways for several release positions along a defined transect (formatted as in Path. Pred.) Pathway Prediction Release Point Evaluation
Particle Tracking Tools Pathway Prediction
Particle Tracking Tools Observation •Understanding • Prediction
Pioneer array: Glider • Depth rating: 200m • Horizontal range: 600-1500 Km • Endurance: ~21 days • Sensor package: • Seabird CTD • Aandera Optode • WetLabs BB2FLSL0: CDOM, • Chlorophyll Fluorometer, Scattering meter • Plan • Climatology for plan • Data • Model/data comparison Grays Harbor line
Circulation forecasts RDFS: http://rdfs.stccmop.org For the estuary: For the plume and shelf Forecast schedule Tools for data exploration Skill assessment
Forecast schedule Day 0 “yesterday” Day 1 “today” Day 2 “tomorrow” starts ends
Tools for data exploration Model Browser (advanced) Basic info & gateway Special RDFS password needed. Contact Paul Turner (pturner@stccmop.org) RDFS: rapid deployment Get profile at (lat,lon)
Model Browser Interface Select point to open profile data interface transect tool (tricky to use) drag zoom out Distance tool zoom in Select overlays, including lat/lon grid Choose forecast Choose data type (can have 1 of each type) Enter location to see it on the map Step through time
Model profile data interface Choose forecast or hindcast Enter lat-lon Choose date and time (PST) Returns data table And plots Currently returns salinity and temperature, velocity profiles may be added in the near future http://ambwd02.stccmop.org/corie/cruise_support/displaystation
Skill assessment Ugly details Quick scan…
Quick-scan of forecast skill Data: for the duration of the forecast, plot observed values of salinity versus predicted ones. Do this for fdb21, dev and fdb16 (3 curves defined by small dots, different colors) RMSE: Foreground: For day 1 of the forecasts - RMSE of fdb16 (day) vs fdb21; ditto, dev vs fdb21 (two dots, two colors) Background: ditto, for the previous 14 days of forecast (two curves, each with 14 dots; same colors, smaller dots) CRSTC and IOA: as RMSE In preparation
Use this URL to discuss RDFS skill assessment concerns with Paul • http://rdfs.stccmop.org/forecast/sa/displaytimehistory/?hires=on&dev=on&db16=on&fdb21=on&mdplot=on&context=on&plot=Plot&fcast0=fdb21&sa=rmse&id=am169_CT3773_01430_salinity&daynum=1&ndays=90
Analyses Variability - estuary Variability - plume db16 Sep Jan-Dec May Climatology maps Climatology TS Sim DB inventory
Bottom salinity – climatology and anomalies September Climatology Anomaly 1999 1999 2001 2001 2006 2006
Bottom salinity – climatology and anomalies January-December Climatology Anomaly 1999 1999 2001 2001 2006 2006
Bottom salinity – climatology and anomalies May Climatology Anomaly 1999 1999 2001 2001 2006 2006
Winter and summer plume climatology DB14: 1999-2006 Winter Summer
Monthly and inter-annual variability anomalies
Daily variability – May 1999 May climatology (1999-2006) 1999 daily averaged surface S – db14 1 3 4 5 6 7 2 8 9 15 10 11 12 13 trU 14 16 17 23 18 Dev 19 20 21 22 trU psu 31 24 25 26 27 28 29 30
Wind forcing – May 1999 Hourly wind off the river mouth Downwelling-favorable 5 ms-1 Upwelling-favorable Transition to prevailing upwelling–favorable regime Persistent strong upwelling-favorable winds Downwelling episode
Profiler interface Station browser SA interface Station browser SATURN endurance stations SATURN Modeling system Dashboard RDFS QC of phys. Var. Model browser Glider interface AUV interface Model API ? ? ? ? ? Climatology TS Climatology maps Climatology Correlations David Bill Charles Alex Paul
Pigeon drop Animations Hourly snapshots New Horizon: instructions to follow Point Sur: instructions to follow Land mirror: http://www.stccmop.org//CORIE/cruises/cmop/pigeon/mirror The directory structure is …/mirror/[date]/. Under each date will be forecast directories for the db16 (estuary), dev (plume+), fdb21 (estuary, some plume), and fca200mv (experimental) forecasts. Images from standard products can be found in these directories. Each date may also include a “modeling” directory, which will contain anything the modeling team comes up with in addition to standard products, including drifter and tracer images.
People • On vessels • On land