Download
1 / 53
540 likes | 651 Views
Convergence to GZK prediction in UHE measurements of the primary energy spectrum of cosmic rays. J. N. Capdevielle , APC, University Paris Diderot capdev@apc.univ-paris7.fr. Outline. General properties of giant EAS The extrapolation at UHE The treatment of inclined GAS in AGASA

E N D
Convergence to GZK prediction in UHE measurements of the primary energy spectrum of cosmic rays J. N. Capdevielle, APC, University Paris Diderot capdev@apc.univ-paris7.fr
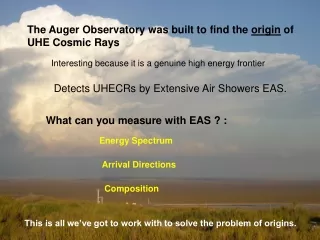
Outline • General properties of giant EAS • The extrapolation at UHE • The treatment of inclined GAS in AGASA • The treatment of the vertical energy estimator • Amendments of experimental data and general convergence to GZK prediction • Mass composition at UHE
Les sources doivent être proches ! Propagation : coupure GZK Greisen, Zatsepin, Kuzmin Interaction des hadrons avec le fond de photons à 3K (CMB) Eseuil = 70 EeV protons
Differential Primary Energy Spectrum of Cosmic Rays Isotropic distribution of sources
Treatment of inclined EAS data from surface arrays and GZK prediction Jean Noël CAPDEVIELLE, F.COHEN, B.SZABELSKA, J.SZABELSKI Measured: lateral distribution + direction (θ, φ) Density (600m, θ) Density(600m, 0) Energy AGASA conversion600 600: 1 = 500 g/cm2 2 = 594 g/cm2 That conversion is energy/size independent See J.phys. G 36 (2009) 075203 by J.N.Capdevielle., F. Cohen, B. Szabelska and J. Szabelski for detailed treatment of inclined EAS
Treatment of inclined EAS data from surface arrays and GZK prediction Jean Noël CAPDEVIELLE, F.COHEN, B.SZABELSKA, J.SZABELSKI Conversion to ''vertical density'' example: Results of CORSIKA simulations show complicated and energy dependent form
Treatment of inclined EAS data from surface arrays and GZK prediction Jean Noël CAPDEVIELLE, F.COHEN, B.SZABELSKA, J.SZABELSKI Cascade theory and CORSIKA simulations results for the highest energies depend on interaction model, but suggest overestimation of energy at AGASA
Treatment of inclined EAS data from surface arrays and GZK prediction Jean Noël CAPDEVIELLE, F.COHEN, B.SZABELSKA, J.SZABELSKI From Bergman spectrum to AGASA spectrum using AGASA conversion Red points: AGASA energy spectrum Grey area: D.R.Bergman et al. (HiRes Collaboration) 29th ICRC, Pune, India, 2005 • histograms: • MC generated spectrum following Bergman • approximately recalculated spectrum using AGASA conversion
Treatment of inclined EAS data from surface arrays and GZK prediction Jean Noël CAPDEVIELLE, F.COHEN, B.SZABELSKA, J.SZABELSKI How does the conversion to ''vertical density'' work ?
Treatment of inclined EAS data from surface arrays and GZK prediction • The spectrum from surface array has to be corrected from the overestimation of the primary energy between 10°-35° in the last decade • the amended spectrum of AGASA (ISVHECRI aug. 06) is progressing in this direction • The overestimation in AGASA data was coming up to 50% (in reason of the maximum depth given by AUGER) of the special properties of 3D Electromagnetic cascade near maximum • It could be more for a pure proton component and less in case of a heavy composition
Fluctuations at constant primary energy 100 EeV 80 EAS Left wing dominated by the effect of cross section
Same EAS taking into account axis localization ( +/-30m) and density measurement (10% error)
Statistical knee effect, decreases the population of high energy EAS in the right wing-- Lower <Eo> Energy Overestimation
Statistical ankle effect , larger population of EAS in right wing- larger <Eo> Energy Underestimation
Conversion S600 Eo dashed curve both spectra error on axis of 30m, lower curve 50m, 10% on density
JEM-EUSO FoV JEM-EUSO tilt-mode EUSO ~ 1000 x AGASA ~ 30 x Auger EUSO (Instantaneous) ~ 5000 x AGASA ~ 150 x Auger AGASA
Principle of EUSO- first remote-sensingfrom space, opening a new window for the highest energy regime TPC-like natural chamber 1020 eV Cf: Ground-based arrays < 100 EUSO Scintillator array,(2)Fluorescence telescope array From College de France: better data now
Conclusions The primary energy measured in giant surface arrays may be overestimated in two steps.: 1/ conversion of inclined density S600 to vertical density of reference without taking into account the behavahiour of the estimator versus zenith angle when the maximum depth is close of the level of the array 2/ conversion of the vertical density to the primary energy without taking into account the statistical disturbances generated by a knee in the differential primary spectrum When corrected for both procedures, AGASA data reflects a GZK behaviour of the primary energy spectrum of cosmic rays in agreement with HIRES and AUGER.
Perspectives • New chances for Proton &Gamma ray Astronomy at UHE from ISS with JEM-EUSO • New results of LHC updating the simulation . • Xmax behaviour and change in p-Air interaction above 3 EeV? • Ratio of light at 500g/cm2 to 1100g/cm2 depends on mass (in favour of p composition at UHE for HIRES)
Ne t G.COCCONI, 1961 De r
Trans GZK AREA • New scales • Adequate Advanced Technologies • Milesbornes to Quantum Gravity • earliest approaches, EUSO and JEM-EUSO
Astronomie proton 1000 evts à répartir sur un certain nombre de sources éventuelles avec leur spectre respectif
Fonction Gaussienne hypergéométrique f(x) = Ne x s-a (1+x) s-b(1+d.x)-c Électrons Avec x = r / r0 et d = r0 / r1 f(x) = N x - (1+x)-(-)(1+.x)- Muons Avec x = r / r’0 et = r’0 / r’1 À angle fixe, il va falloir ajuster les paramètres : a, b, c, r0, r1, , , , r’0 et r’1 Ne , N et “s” sont donnés par la simulation
Treatment of inclined EAS data from surface arrays and GZK prediction Jean Noël CAPDEVIELLE, F.COHEN, B.SZABELSKA, J.SZABELSKI Georgi Timofeevich Zatsepin (2006) Vadim Alekseyevich Kuzmin (2006)