Download
1 / 21
210 likes | 333 Views
Anisotropy of the Highest Energy Cosmic Rays. 3.7 years of surface array data from the Auger Southern Observatory. Introduction Evidence for anisotropy Observatory & Data set Search method Exploratory scan AGN correlation signal Maximum correlation parameters Properties of the signal

E N D
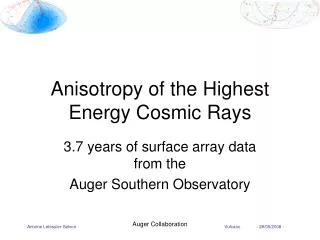
Anisotropy of the Highest Energy Cosmic Rays 3.7 years of surface array data from the Auger Southern Observatory Auger Collaboration
Introduction • Evidence for anisotropy • Observatory & Data set • Search method • Exploratory scan • AGN correlation signal • Maximum correlation parameters • Properties of the signal • Discussion • Source identification • GZK horizon • Angular deflection • Acceleration sites • Conclusions Auger Collaboration
Identification of UHECR sources is a challenges since 1962 and one of the purpose of Auger • Due to GZK effect only nearby (200 Mpc) Universe should contribute above 60 EeV • If magnetic bending is within a few degrees source anisotropy should reflect in CR arrival direction • Auger southern observatory : Hybrid quality AND very large exposure • AGN have long been considered as potential sites for acceleration of UHECR Auger Collaboration
20 km Fluorescence Telescopes Water Cherenkov Detectors Auger Collaboration
The Hybrid Design • A large surface detector array with air fluorescence detectors results in the unique and powerful design • Simultaneous shower measurement allows for transfer of the nearly calorimetric energy calibration from the fluorescence detector to the event gathering power of the surface array. • A complementary set of mass sensitive shower parameters contributes to the identification of primary composition. • Different measurement techniques force understanding of systematic uncertainties in each. • Reconstruction synergy for precise measurements in hybrid events. Auger Collaboration
Auger south : Lat -35.2º South, Long. 69.5º West, m.a.s.l. 1400 m • 154 surface array detectors and 2 FD sites in January 2004 • 1388 surface array detectors and 4 FD sites in September 2007 • Over a million CR events recorded above about 0.2 EeV. • Full acceptance above 3 EeV for zenith < 60º • Data set : January 1st 2004 until August 31st 2007, 81 events • T5, • E > 40 EeV, • < 60º • Geometrical exposure sin[] or rate sin2[]. Array growth modulation or atmospheric effects < 1%. Auger Collaboration
Anisotropy search method • Define a data set (adjusting minimum energy E) • Define a tentative source catalog (adjusting catalog depth z) • Count number of events k at less than angular distance from a source (we call this a correlation) • Calculate probability for k or more such correlations to occur by chance : • ` where P(E,z,)is the cumulative binomial probability and p(z, ) is the probability for a random CR seen by Auger (exposure weighted) to fall within º of one of the sources in the catalog • Look for the minimum of P(E,z,)as a function of E, z and . Auger Collaboration
Exploratory search done before June 2006 • Scan on parameter E, z and to find minimum ofP. • Start with highest energy event and add events one by one down to a minimum energy of 20 EeV. (241 events total) • Use 12th edition of Veron-Cetty & Veron AGN catalog, using sources up to z=0.05 in steps of 0.002 • Evaluate correlations for varying form 1.1º up to 6.1º in step of 0.5º • Minimum of P(E,z,) : • E = 56 EeV • Z = 0.018 • = 3.1º 12 out of the 15 events selected correlate, P = 10-6 • But… We have made a scan so P must be penalized (penalization is of order 103 as evaluated from MC samples). Accurate calculation of the penalization cannot be achieved hence : Motivation for a prescription Auger Collaboration
A prescription • We decided to test this putative signal on an independent data set • We fixed the correlation parameters as those given by the minimum of the exploratory scan: • E = 56 EeV • Z = 0.018 • = 3.1º • We constructed a series of tests, each one being applied after the arrival of each new event with energy > 56 EeV • The data would be declared anisotropic (CL>99%) if any of the test succeeds before the arrival of the 34th event. If, at the 34th event no test succeeded, the prescription would be dropped definitively and no conclusion could be drawn regarding the (an)isotropy of the data • On May 28th 2007 the 3rd test in the series was successful with 6 out of 8 events in correlation We can now study our signal Auger Collaboration
Likelihood ratio to monitor evolution of signal R< /(1- ) Accept H0 (isotropy) R> (1- )/ Accept H1(anisotropy) Type I error = 1%, Type II error = 5% Likelihood ratio R as a function of the number of events observed in the prescribed test. The null hypothesis (anisotropy) is rejected at the 99% likelihood threshold with 10 events. Shaded regions indicate expectations from isotropy at the 68% and 95% CL. Auger Collaboration
Full data set analysis (01/01/2004-31/08/2007) 81 events above 40 EeV • New minimum : 20 out of the 27 events selected correlate • E = 57 EeV • Z = 0.017 • = 3.2º 5.6 events expected by chance “raw” P = 5x10⁻⁹ • After penalization P ~ 10-5 note that this is about: 10-3(exploratory) x 10-2(prescribed) Similar minima in the region E~60 EeV, z < 0.024, 2º < < 6º Auger Collaboration
An iso-exposure Mollweide map Auger Collaboration
Aitoff projection in Galactic coordinates • - Circles of radius 3.1º centered at the arrival directions of 27 CR with E > 57 EeV. • - Red asterisks positions of the 472 AGN (318 within the field of view) with z<= 0.018. • Solid line border of the field of view for the southern site of the Observatory ( <60º). • Dashed line super-galactic plane. • Color bands indicates relative exposure. Each colored band has equal integrated exposure. • - White asterisk Centaurus A Auger Collaboration
Properties (cont’d) • Second minimum P = 8x10⁻⁹ at E=57 EeV, z=0.013 and = 4.8º • The V-C catalog is likely to be incomplete near the Galactic plane also the Galactic magnetic field is stronger in the disk. Out of the 7 events out of the correlation, 5 are within 12º of the Galactic Plane. • Cutting on the Galactic Plane (|b|<12º) the minimum reads : P = 2x10⁻¹⁰ at E=57 EeV, z=0.017 and =3.2º, with 19 of of 21 events in correlation where 5 are expected • We can place a lower limit on the minimum multipolar moment (Yl,m) necessary to describe de distribution of the data. Above 50 EeV, l > 5 @ 99 % CL • The signal is visible in the autocorrelation function Auger Collaboration
Auto-correlation Number of pairs separated by less than a given angle among the 21 events with E>57EeV and |b| > 12º (points) and average expectation for 21 directions from AGN in the V-C catalog with z<= 0.018 and the same cut in galactic latitude. Number of pairs separated by less than a given angle among the 27 events with E>57 EeV (points) and average expectation for an isotropic flux, along with 90\% CL dispersion. Auger Collaboration
Acceleration sites • Can we say something about the sources? • They are not in the Milky Way • They correlate with matter hence are likely bottom up (astrophysical) • AGN are plausible acceleration sites • More data are needed to identify the sources and their characteristics Auger Collaboration
Magnetic deflections IF BSS model correct then angular scale of correlation is compatible with proton dominance at Earth Distribution of the deflections for protons in the BSS-S model of the galactic magnetic field. Left: 1000 directions, isotropic flux in proportion to the exposure of the Observatory, for E> 60 EeV. Right: deflections of the 27 arrival directions of the observed events with E> 57 EeV Angular separations to the closest AGN (21 events) and average expectation for an isotropic flux (dashed line). Auger Collaboration
GZK cut off Maximum signal occurs @ same energy where the flux is reduced by 50% with respect to an extrapolated power law Auger Collaboration
Conclusions It is just the beginning…. • Anisotropy of UHECR has been established at > 99% CL for the parameters E~60 EeV, D~100 Mpc, ~4º • Nature of the correlation provides evidences for the ‘GZK’ effect and the hypothesis that the CR are dominantly protons from AGN within our ‘GZK’ horizon • Sources could be other than AGN as long as they have similar spatial distributions • Increased statistics (+Auger North) will allow source identification as well as measurements of MF along the line of sight and maybe some surprises…. Auger Collaboration