Download
1 / 25
250 likes | 252 Views
Discover the origins of UHE Cosmic Rays with the Auger Observatory, measuring energy spectrum, arrival directions, and composition using Extensive Air Showers (EAS).

E N D
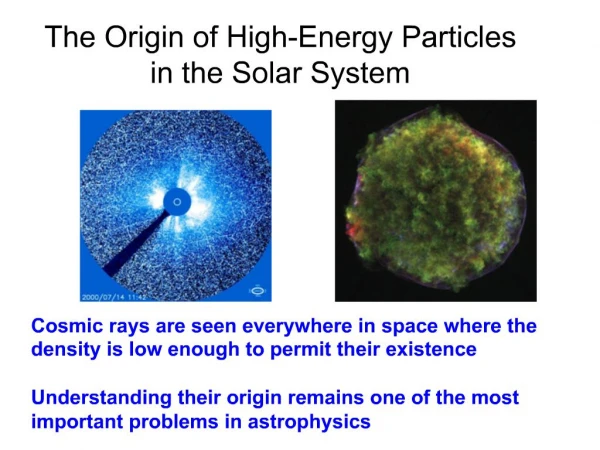
The Auger Observatory was built to find the origin of UHE Cosmic Rays Interesting because it is a genuine high energy frontier Detects UHECRs by Extensive Air Showers EAS. What can you measure with EAS ? : Energy Spectrum Arrival Directions Composition This is all we’ve got to work with to solve the problem of origins.
Scientific Progress Seems hopeless : But look at the Cosmic Micro-wave Background We are only able to measure the same three things for incoming MBR photons. Spectrum - Thermal Age of Universe Composition - Photons Geometry of the space Directionality - Slight anisotropy Baryon fraction etc What we know about CRs now. Spectrum – Non-Thermal power law. Isotropic – with a hint at some anisotropy at the highest energies Composition - ???? Doesn’t tell us much without composition – at the moment.
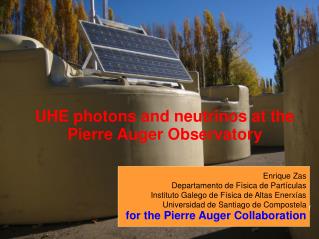
The Auger Cosmic Ray Observatory Surface Array 1600 detector stations 1.5 Km spacing 3000 Km2 Fluorescence Detectors 4 Telescope enclosures 6 Telescopes per enclosure 24 Telescopes total
The Auger Hybrid Observatory Fluorescence Detector 6 Telescopes – 30ox30o field of view 10 m2 water cherenkov tank
EAS viewed by all 4 fluorescence detectors and the surface array. May 20, 2007
Typical flash ADC trace at about 2 km Detector signal (VEM) vs time (µs) Lateral density distribution PMT 1 PMT 2 PMT 3 θ~ 48º, ~ 70 EeV 18 detectors triggered Flash ADC traces Flash ADC traces
An EAS seen simultaneously with the Surface Detector and Fluorescence Detector. SD Data FD Data
How can composition measurements help in our quest for cosmic ray origins? Two Divisions in UHECR theories of origin Top-Down Bottom-up (Z-BurstModel). UHE ns annihilate on relic ns and produce a Z boson, which decays into UHE photons and light hadrons. Stochastic acceleration (shock acceleration) (SHDM Models ) Decay of super-heavy dark matter particles. [relic metastable particles] (SHDM Models) . Berezinsky (1997) Charged particle flux Possibility of heavy nuclei (TD models) Decay of relic Topological Defects Cosmic Strings decay into UHE photons Large Photon flux at High Energies
Look for the photons predicted by the Top Down models. Composition information is reflected in shower development behavior. (Also Muon content) Vertical 1019 eV Corsika Simulations (Example) Different primary particle types produce showers that maximize at different depths. (different “Xmax’s”. For a fixed energy. Look for showers with deep Xmax.
Can we do this with the much larger SD data set? Surface Detector parameters that correlate with Xmax : I. Tank signal Rise-time t1/2 (at 1000m from the core) Shower size grows to ½ maximum Shower size grows to ½ maximum Xmax b b Xmax a a Surface Station Surface Station Deep Xmax, ta-tb ~ t1/2 large. Shallow Xmax, t1/2small. t1/2 is weakly correlated with Xmax
II. Shower Front Radius of Curvature rc. Shower axis Xmax Xmax rc rc Ground level Shallow Xmax, Large rc rc is anti-correlated with Xmax Deep Xmax, Smaller rc Plan : Use the much more prolific SD data to search for photons. 10x the data as FD but less accurate. • Look for photon-induced showers with • Large t1/2 and • Small rc
Use Data from 1January 2004 to 31 December 2006. Energies above 10 EeV Zenith Angles between 30o and 60o Integrated Aperture = 3130 km2 sr yr ~ 1 full array year 2761 events pass the quality cuts. Procedure : For each event form the deviation from the expectation for a photon shower. Is the average of an ensemble of simulated photon showers with the same S(1000) and q as the recordedd event. (X is either t1/2 or Rc)
Apply this same procedure to a spectrum-generated set of Monte Carlo photon showers. a = 2 You get the greatest separation between photons and nuclears along this axis. Find principle axis using first 5% of the data.
Remaining 95% of data is projected on to the principle axis. Mean of photon distribution Photon candidates lie above the dashed line. There are no Photon candidates in the events above 10 EeV.. 10EeV 20 EeV 40EeV Photon Flux Limits 3.8x10⁻³ 2.5x10⁻³ 2.2x10⁻³ km-2sr-1yr-1 2.0% 5.1% 31% Photon Fraction
Limits on Photon Fraction - Most Top Down Models are disfavored but not ruled out
Photon Flux Limits compared to Top Down Model estimates Top Down models clearly disfavored at all measured energies.
Bottom up theories – share acceleration mechanism but differ on what gets accelerated and what makes it into our detectors. 1. If the acceleration/injection region is benign (low radiation density) we might expect a nearly solar composition of nuclei to be accelerated and propagated. 2. Otherwise we might have only protons. Measurement of Nuclear composition might thus lead us to an understanding of the injection/acceleration process. Both cases predict the same features in the energy spectrum!
“dip” due to changing source distribution Cut-off due to GZK effect and Nuclear breakup Extra-galactic flux must be mixed to match all the features. (Allard et. Al.)
“Dip” due to pair production Off the MBR. Cut-off due to GZK effect (Berezinsky et al)
The separation between nuclear species is quite small compared with photons. Requires the accuracy of the Hybrid detector and direct measurement of EAS development. Plan : Look at the average Xmax as a function of energy. Compare with Monte Carlo estimates.
Use hybrid data from December 2004 through April 2007 FD showers with at least one triggered SD station. Quality cuts : Xmax in field of view Profile fit c2 pdf. <= 2.5 DXmax < 40 gm cm-2 DE/E < 20% Min Viewing Angle > 20o Geometrical cuts – minimize composition biases due to different detection efficiencies for different species. 4329 events remain after the cuts.
Data compared to EPOS1.6 Pure Composition Predictions [Getting Heavier] [Constant] Best fit : two linear regions with a break in slope at 1018.35 eV Mixed composition everywhere. Constant comp. low energy : At high energy , getting heavier
Data Compared to QGSJET pure composition predictions [Getting lighter] [Constant] Mixed composition everywhere Getting lighter at low energy : Constant at high energy.
Bad news : composition behavior depends on what interaction model you use, and the different models do not agree. Will have to use some additional composition handle to sort this out. eg Dispersion in Xmax or Average Muon content. Good news : All interaction models agree on a mixed composition everywhere. The pure proton model is disfavored – even at this early stage.
Summary Scientific progress has been made on finding the origin of UHE cosmic rays by composition studies Searches for photons have produced flux limits which disfavor most Top-Down theories. An analysis of average Xmax has found a mixed composition which disfavors a class of pure proton source models. Future studies have to be performed to establish the mixed composition conclusion in a model-indepentent way.