Download
1 / 41
450 likes | 688 Views
Transport in nanowire MOSFETs: influence of the band-structure. M. Bescond IMEP – CNRS – INPG (MINATEC), Grenoble, France Collaborations: N. Cavassilas, K. Nehari, M. Lannoo L2MP – CNRS, Marseille, France A. Martinez, A. Asenov University of Glasgow, United Kingdom

E N D
Transport in nanowire MOSFETs: influence of the band-structure M. Bescond IMEP – CNRS – INPG (MINATEC), Grenoble, France Collaborations: N. Cavassilas, K. Nehari, M. Lannoo L2MP – CNRS, Marseille, France A. Martinez, A. Asenov University of Glasgow, United Kingdom SINANO Workshop, Montreux 22nd of September
Motivation: improve the device performances Gate-all-around MOSFET: materials and orientations Ballistic transport within the Green’s functions Tight-binding description of nanowires Conclusion Outline 2
Towards the nanoscale MOSFET’s • Scaling of the transistors: New device architectures Improve potential control Gate-all-around MOSFET1: Increasing the number of gates offers a better control of the potential New materials and orientations Improve carrier mobility • Ge, GaAs can have a higher mobility than silicon (depends on channel orientation). • Effective masses in the confined directions determine the lowest band. • Effective mass along the transport determines the tunnelling current. 1M. Bescond et al., IEDM Tech. Digest, p. 617 (2004). 3
3D Emerging architectures • 3D simulations: The gate-all-around MOSFET
Gate-All-Around (GAA) MOSFETs TSi=WSi=4nm TOX=1nm • Source and drain regions: N-doping of 1020 cm-3. • Dimensions: L=9 nm, WSi=4 nm, and TSi=4 nm, TOX=1 nm. • Intrinsic channel. 5
ith eigenstate of the nth atomic plan 3D Mode-Space Approach* 1D (transport) The 3D Schrödinger = 2D (confinement) + 1D ( transport) 2D (confinement) • 3D Problem = N1D Problems Saving of the computational cost!!!! • Hypothesis: n,i is constant along the transport axis. * J. Wang et al., J. Appl. Phys. 96, 2192 (2004). 6
Different Materials and Orientations + Effective Mass Tensor (EMT) Ellipsoid coordinate system (kL, kT1, kT2) Device coordinate system (X, Y, Z) + Rotation Matrices 8
Theoretical Aspects* • 3D Schrödinger equation: Potential energy H3D: 3D device Hamiltonian Coupling * F. Stern et al., Phys. Rev. 163, 816 (1967). 9
Theoretical Aspects* • The transport direction X is decoupled from the cross-section in the 3D Schrödinger equation: Coupling • Where E’ is given by: • mtrans is the mass along the transport direction: • M. Bescond et al., Proc. ULIS Workshop, Grenoble, p.73, April 20th-21st 2006. • M. Bescond et al. JAP, submitted, 2006. 10
ith eigenstate of the nth atomic plane 3D Mode-Space Approach 1D (transport) The 3D Schrödinger = 2D (confinement) + 1D ( transport) 2D (confinement) • Resolution of the 2D Schrödinger equation in the cross-section: mYY, mZZ, mYZ. • Resolution of the 1D Schrödinger equation along the transport axis: mtrans. 11
-valleys Semiconductor conduction band • Three types of conduction band minima: Electron Energy • (ellipsoidal): mlmt non diagonal EMT • (ellipsoidal): mlmt non diagonal EMT E E EΔ • (spherical): ml=mt diagonal EMT -valleys 12
Results: effective masses • Wafer orientation: <010> 13
Material: Ge • Square cross-section: 44 nm, <100> oriented wire mYY=0.2*m0mZZ=0.95*m0mtrans=0.2*m0 Z 4-valleys 1st 2nd mYY=0.117*m0mZZ=0.117*m0mYZ-1=±1/(0.25*m0) mtrans=0.6*m0 6 nm -valleys Free electron mass Non-diagonal terms in the effective mass tensor couple the transverse directions in the -valleys 14
Material: Ge • Square cross-section: TT=55 nm, <100> oriented wire • Total current is mainly defined by the electronic transport through the -valleys (bulk) • Tunneling component negligible due to the value of mtransin the -valleys (0.6*m0) 15
Material: Ge • Square cross-section: 44 nm, <100> oriented wire 4-valleys: mYY=0.2*m0, mZZ=0.95*m0 -valleys: mYY=0.117*m0, mZZ=0.117*m0 The 4 become the energetically lowest valleys due to the transverse confinement 16
Material: Ge* 4-valleys: mtrans=0.2*m0 versus -valleys: mtrans=0.6*m0 The total current increases by decreasing the cross-section! * M. Bescond et al., IEDM Tech. Digest, p. 533 (2005). 17
3D Emerging architectures • Influence of the Band structure: Silicon
Why? • Scaling the transistor size • devices = nanostructures • Electrical properties depend on: • Band-bap. • Curvature of the bandstructure: effective masses. • Atomistic simulations are needed1,2. • Aim of this work: describe the bandstructure properties of Si and Ge nanowires. 1J. Wang et al. IEDM Tech. Dig., p. 537 (2005). 19 2K. Nehari et al. Solid-State Electron.50, 716 (2006).
Concept: Develop the wave function of the system into a set of atomic orbitals. sp3 tight-binding model: 4 orbitals/atom: 1 s + 3 p Interactions with the third neighbors. Three center integrals. Spin-orbit coupling. Tight-Binding method Band structure calculation 3rd (12) Diamond structure: 2nd (12) 1st (4) Reference 20
Tight-Binding method Band structure calculation • 20 different coupling terms for Ge:* • Coupling terms between atomic orbitals are adjusted to give the correct band structure: semi-empirical method. * Y.M. Niquet et al. Phys. Rev. B, 62 (8):5109-5116, (2000). 21 *Y.M. Niquet et al., Appl. Phys. Lett. 77, 1182 (2000).
Simulated device Si Nanowire Gate-All-Around transistor Silicon Hydrogen Schematic view of a Si nanowire MOSFET with a surrounding gate electrode. Electron transport is assumed to be one-dimensional in the x-direction. The dimensions of the Si atomic cluster under the gate electrode is [TSix(W=TSi)xLG]. 22
-valleys Energy dispersion relations • In the bulk: The minimum of the conduction band is the DELTA valleys defined by six degenerated anisotropic bands. Constant energy surfaces are six ellipsoids 23
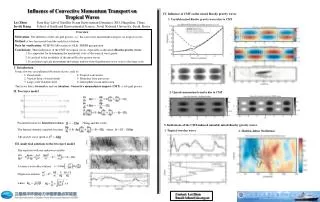
Energy dispersion relations T=2.72 nm T=5.15 nm T=1.36 nm Energy dispersion relations for the Silicon conduction band calculated with sp3 tight-binding model. The wires are infinite in the [100] x-direction. • Direct bandgap semiconductor • The minimum of D2 valleys are zone folded, and their positions are in k0=+/- 0.336 • Splitting between D4 subbands 24
Conduction band edge and effective masses Bandgap increases when the dimensions of cross section decrease m* increases when the dimensions of cross section decrease : 25
Results Current-Voltage Caracteristics 2.98 nm 1.9 nm 1.36 nm ID(VG) characteristics in linear/logarithmic scales for three nanowire MOSFET’s (LG=9nm, VD=0.7V) with different square sections. • No influence on Ioff, due to the reduction of cross section dimension which induces a better electrostatic control • Overestimation of Ion (detailled on next slide) 26
Results Overestimation on ON-Current When the transverse dimensions decrease, the effective masses increase and the carrier velocity decreases. Overestimation of the Ion current delivered by a LG=9nm nanowire MOSFET as a function of the wire width when using the bulk effective-masses instead of the TB E(k)-based values. K. Nehari et al., Solid-State Electronics, 50, 716 (2006). K. Nehari et al., APL, submitted, 2006. 27
3D Emerging architectures • Influence of the Band structure: Germanium
-valleys Conduction band minima • Three types of conduction band minima: • L point: four degenerated valleys (ellipsoidal). • point: single valley (spherical). • directions: six equivalent minima (ellipsoidal). -valleys 29
2 bulk valleys 4 bulk valleys 4 bulk valleys Single bulk valley 4 bulk valleys Dispersion relations* T=5.65 nm Ge <100> • Indirect band-gap. • The minimum of CB obtained in kX=/a corresponding to the 4 bulk valleys. • Second minimum of CB in kX=0, corresponding to the single bulk valley (75% of s orbitals). *M. Bescond et al. J. Comp. Electron., accepted (2006). 30
Dispersion relations Ge <100> T=1.13 nm • The four bands at kX=/a are strongly shifted. • The minimum of the CB moves to kX=0. • The associated state is 50% s ( character) and 50% p ( and character) Quantum confinement induces a mix between all the bulk valleys. • These effects can not be reproduced by the effective mass approximation (EMA). 31
Effective masses: point Ge <100> (1/m*)=(4 ²/h²)( ²E/ k²) • Significant increase compared to bulk value (0.04m0): • From 0.071m0 at T=5.65nm to 0.29m0 at T=1.13nm increase of 70% and 600% respectively. • Other illustration of the mixed valleys discussed earlier in very small nanowires. 32
Effective masses: kX=/a Ge <100> • Small thickness: the four subbands are clearly separated and gives very different effective masses. • Larger cross-sections (D>4nm): the effective masses of the four subbands are closer, and an unique effective mass can be calculated: around 0.7m0 (effective mass: mtrans=0.6m0 for T=5nm) • The minimum is not obtained exactly at kX=/a: 33
Band-gap: Ge vs Si Ge <100> • For both materials: the band gap increases by decreasing the thickness T (EMA). • EG of Ge increases more rapidly than the one of Si: Si and Ge nanowires have very close band gaps. • Beneficial impact for Ge nano-devices on the leakage current (reduction of band-to-band tunneling). 34
Effective masses: Valence Band • Strong variations with the cross-section: from -0.18m0 to -0.56m0 (70% higher than the mass for the bulk heavy hole). 35
Conclusion • Study of transport in MOSFET nanowire using the NEGF. • Effective Mass Approximation: different materials and orientations (T>4-5nm). • Thinner wire: bandstructure calculations using a sp3 tight-binding model. • Evolution of the band-gap and effective masses. • Direct band-gap for Si and indirect for Ge except for very small thicknesses (« mixed » state appears at kX=0). • Bang-gap of Ge nanowire very rapidly increases with the confinement: band-to-band tunneling should be attenuated. • Ge is much more sensitive then Si to the quantum confinement necessity to use an atomistic description + Full 3D* * A. Martinez, J.R. Barker, A. Asenov, A. Svizhenko, M.P. Anantram, M. Bescond, J. Comp. Electron., accepted (2006) * A. Martinez, J.R. Barker, A. Svizenkho, M.P. Anantram, M. Bescond, A. Asenov, SISPAD, to be published (2006) 36
+ • Due to the Fermi-Dirac distribution (1 e-/state) which limits the electron injection in the active region Resistance of the reservoirs • Rq: If bosonic particles: Description of ballisticity: the Landauer’s approach 1D case: Concept of conduction channel and quantum of conductance • Current density from Left to right: • Total current density: • Quantum of conductance: extra
Resistance of the reservoirs Resistance of the reservoirs: the Fermi-Dirac distribution limit the electron quantity injected in a subband (D0=2e2/h). extra
Towards the nanoscale MOSFET’s 1971 1989 1991 2001 2003 410M 42M 1.2M transistors /chip 134 000 2300 Channel length of ultimate R&D MOSFETs in 2006 10 µm 1 µm 0.1 µm 10 nm De Broglie length in semiconductors quantum effects Mean free path in perfect semiconductors ballistictransport extra
E(k) Parabolic approximation of an homogeneous material Parabolic approximation of a finished system of atoms 0 k Semi-empirical methods Effective Mass Approximation (EMA): • Near a band extremum the band structure is approximated by an parabolic function: (Infinite system at the equilibrium) extra
Numerical Aspects • Simulation Code • Potential energy profile (valley (010)) Electrostatic potential 2D Schrödinger Resolution 1D density (Green) Self-consistent coupling 3D density (Green) New electron density Poisson (Neumann) New electrostatic potential The transverse confinement involves a discretisation of the energies which are distributed in subbands Current Extra