Download
1 / 15
150 likes | 317 Views
Agency Conflicts: Some Economic Solutions. A presentation by Akobundu Chinesom Ejiasa. Who? What? Where? When? and why?. What is Agency Theory? What is Agency Cost?. The Approach.

E N D
Agency Conflicts: Some Economic Solutions A presentation by Akobundu Chinesom Ejiasa
Who? What? Where? When? and why? • What is Agency Theory? • What is Agency Cost?
The Approach Hypothesis: Firms can reduce their susceptibility to agency costs through the use of dependency variables. Firms can control agents by tying compensation structures to operational dependencies. a. Company 1: high leverage and low programmability b. Company 2: low leverage and high programmability
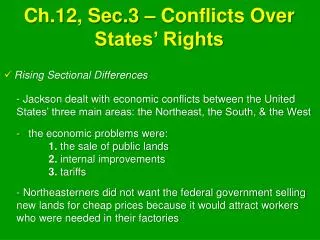
Firm Leverage 1. A firms leverage implies much about its dependencies. a. Consider a firm with high leverage; it is more likely to rely on debt than a firm that requires little debt financing. Therefore this type of debt laden firm is highly dependent on creditors b. Consider a firm with low leverage; it is more likely to rely on equity financing than a firm that is highly levered. Therefore this type of firm is highly dependent on equity financiers.
DEBT EQUITY RATIO (HIGH) AVG. COST Of DEBT(+) FREE CASH FLOW(-) DEBT EQUITY RATIO (LOW) AVG. COST Of DEBT(+) FREE CASH FLOW(+) Diagram of Leverage *The debt to equity ratio is used to determine the leverage of each firm. In this case leverage is based on the industry of each firm. If a firm posts higher leverage than its industry, it will be considered highly levered, and the opposite for low levered firms. The average cost of debt is as a performance measure. The assumption is high-levered firms will have an average cost of debt greater than the industry’s average and that free cash flows have a negative relationship with the debt equity ratio.
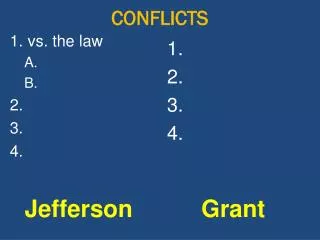
Firm Programmability 1. Another aid in reducing a firms susceptibility to agency costs is how well the internal monitoring structure functions. a. The size of a board and the number of times it meets is reflective of how well the company is functioning. 2. Boards of a membership twelve and greater are considered inefficient while memberships of nine and smaller are considered efficient. 3. Boards that held meetings of twelve and higher were considered efficient, while annual meetings that summed below six were considered inefficient.
ROA(-) ROE(-) MTB VALUE(-) BOARD SIZE FREQ of MEETINGS ROA(+) ROE(+) MTB VALUE(+) Diagram of Monitoring *The board size variable is separated into large board sizes and small board sizes. A board of twelve and higher represents high programmability whereas a board size of six and below represents low programmability. The mean of the return on equity and market to book value will be taken for both the high programmable firms and the low programmable firms.
Combining leverage and monitoring a.Board size has a negative relationship to the performance variables return on equity and/ or market to book value, and frequency of board meetings has a positive relationship to the performance variables return on equity and/or market to book value. b.As the debt equity ratio increases, the quantity of free cash flow should decrease, which implies a negative relationship between free cash flows and debt equity and indicates that managerial actions are better aligned with shareholders’ interest.
Results for Programmability(board size) t-Test of significance for programmability (board size).
Results for Programmability(frequency) t-Test of significance for programmability (meeting frequency).
Results for Leverage t-Test of Significance for Leverage and Free Cash Flows.
WHAT HAPPENED? • THE SIZE OF THE DATA SET • THE VARIATION IN THE DATA SET • AIRLINE INDUSTRY
ACKNOWLEDGEMENTS • Thanks to Judy for being a pain in my side for 2 months. • Thanks to Aju Fen for assisting me in during my times of dire need. • Thanks to Kate and Shannon for keeping things humorous during our many hours of lab work. • Thanks to everyone else who I might have forgotten.