Download
1 / 43
430 likes | 514 Views
Team. Philosohook. PHAT-TACO Experiment Pressure Humidity And Temperature Tests And Camera Observations Hannah Gardiner, Bill Freeman, Randy Dupuis, Corey Myers, Andrea Spring. Flight Readiness Review. Goals and objectives Science background Payload Design Mechanical Design

E N D
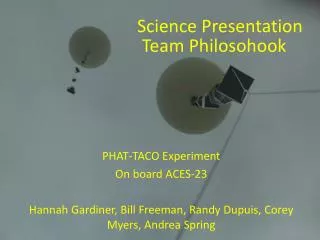
Team Philosohook PHAT-TACO Experiment Pressure Humidity And Temperature Tests And Camera Observations Hannah Gardiner, Bill Freeman, Randy Dupuis, Corey Myers, Andrea Spring
Flight Readiness Review • Goals and objectives • Science background • Payload Design • Mechanical Design • Electronics Design • Software Design • Flight Operations
Mission Goal • To study the layers of the atmosphere using an instrumented sounding balloon flown in East Texas during May and to analyze the balloon and the environment surrounding the payload in order to study the relationship between the temperature and humidity profiles acquired during flight.
Objective • The overall objective is to measure and record humidity, pressure, and internal and external temperature on a sounding balloon flight while taking video of the flight.
Science Background: Earth’s Atmosphere • Troposphere • Clouds • Stratosphere • Less humidity & lower pressure than the Troposphere http://www.wyckoffschools.org/eisenhower/teachers/chen/atmosphere/earthatmosphere.htm
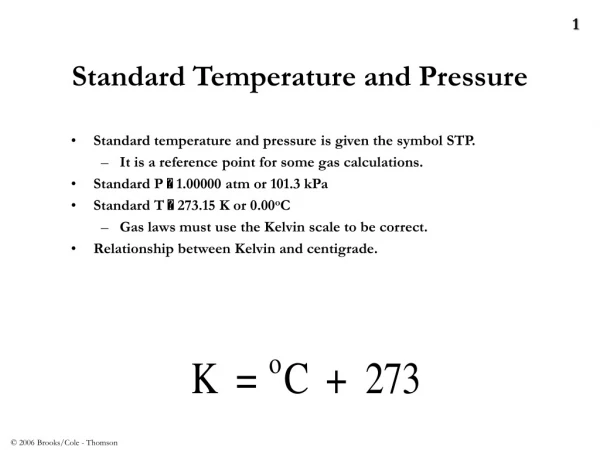
US Model Atmosphere1 1976 • “A hypothetical vertical distribution of atmospheric temperature, pressure, and density” • Can calculate properties of the atmosphere • Pressure • Temperature • Density 1U.S. Standard Atmosphere, 1976, U.S. Government Printing Office, Washington, D.C., 1976.
Balloon Radius • Kaymont3000 gm sounding balloon • Ascent rate should be constant during flight • Has not been in previous flights
Thermal Design • Temperature Range: -80oC to 30oC • Construction Material: Insulating foam with a low thermal conductivity • Heat produced by electronics • 15.8oC
Payload Design External Internal A 14 cm x 15.5 cm insert will hold all components Batteries and camera on one side BalloonSat and Conditioning on the other Secured by Velcro • Hexagonal • 10 cm sides • 14 cm high; 17.5 cm including the bottom • 1 hole in the lid for the camera
Mechanical Drawings - External Top Front
Software Background • Basic stamp controls everything • Measure and record temperature, pressure, and humidity every six seconds • Check to see if the camera is recording • Stop, then restart the video every 10 minutes • Save “camera status byte” to EEPROM
Pre Flight Flowchart • Must be able to calibrate Real Time Clock (RTC) • LaACES Management will provide a flight profile of altitude vs time • First two bytes on the EEPROM store the location of the last saved data point
During Flight • Controls all aspects of the payload • Takes T,P,H data every 6 sec • Also checks if the camera is still recording
Post Flight Flowchart • Must be able to read out all data to debug screen • Excel data sheet will contain conversions from ADC counts to atmospheres, kelvin, and % humidity • Excel sheet will also convert timestamps into altitude
Post flight Balloon Radius Calculator • Doesn’t need entire balloon to calculate radius • Works similar to most “fitting” programs • Better than only using two points
Temperature Calibration External temperature sensor: Temperature(C°) = -.4439(ADC Count) + 28.3 Error: ((.013151*ADC Count)^2+(.917709)^2)^.5 C°
Temperature Calibration Internal temperature sensor: Temperature(C°) = 1.5648(ADC Count) - 364.2 Error: 2.07 C° (error variation because of ADC Counts is very small)
Pressure Calibration Pressure Counts Pressure Sensor: Pressure(Atm)=.0039464(ADC counts)-.002953703 Error=((1.98378e-5*ADC counts)^2+(.002055339)^2)^.5 Atm
Humidity Calibration Humidity Counts Humidity Sensor: RH(%)= 0.4003(ADC count) – .1047 Error: ((0.01453*ADC count)^2+(2.706038)^2)^.5%
What is next • Flight • Analysis of data • Science Presentation