Download
1 / 44
440 likes | 545 Views
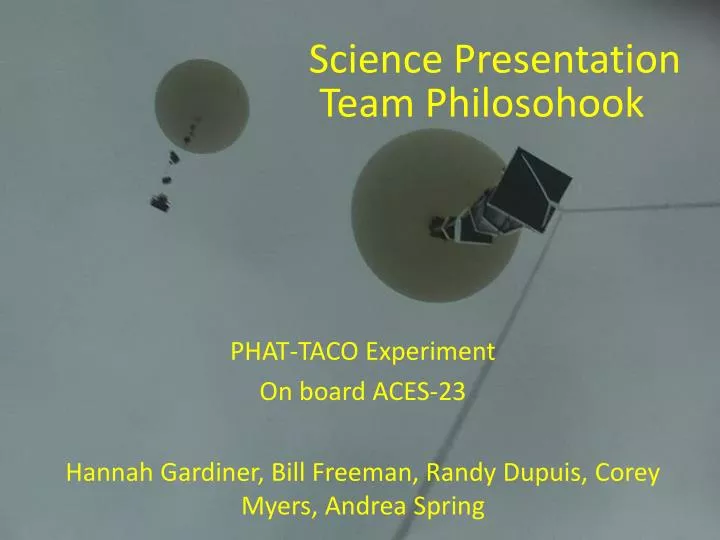
Science Presentation. Team Philosohook. PHAT-TACO Experiment On board ACES-23 Hannah Gardiner, Bill Freeman, Randy Dupuis, Corey Myers, Andrea Spring. Science Presentation. Goals and objectives Science background Mechanical Design Electrical Design Testing Calibrations Results .

E N D
Science Presentation Team Philosohook PHAT-TACO Experiment On board ACES-23 Hannah Gardiner, Bill Freeman, Randy Dupuis, Corey Myers, Andrea Spring
Science Presentation • Goals and objectives • Science background • Mechanical Design • Electrical Design • Testing • Calibrations • Results
Mission Goal • To study the layers of the atmosphere using an instrumented sounding balloon flown in East Texas during May and to analyze the balloon and the environment surrounding the payload in order to study the relationship between the temperature and humidity profiles acquired during flight.
Objective • The overall objective is to measure and record humidity, pressure, and internal and external temperature on a sounding balloon flight while taking video of the flight.
Science Background: Earth’s Atmosphere • Troposphere • Clouds • Stratosphere • Less humidity & lower pressure than the Troposphere http://www.wyckoffschools.org/eisenhower/teachers/chen/atmosphere/earthatmosphere.htm
US Model Atmosphere1 1976 • “A hypothetical vertical distribution of atmospheric temperature, pressure, and density” • Can calculate properties of the atmosphere • Pressure • Temperature • Density 1U.S. Standard Atmosphere, 1976, U.S. Government Printing Office, Washington, D.C., 1976.
Balloon Radius • Kaymont3000 gm sounding balloon • Ascent rate should be constant during flight • Has not been in previous flights
Our Flight Path Local Area Regional Area Palestine to Rusk
Mechanical Drawings - External Top Front
Temperature Calibration External temperature sensor: Temperature(C°) = -.4439(ADC Count) + 28.3 Error: ((.013151*ADC Count)^2+(.917709)^2)^.5 C°
Temperature Calibration Internal temperature sensor: Temperature(C°) = 1.5648(ADC Count) - 364.2 Error: 2.07 C° (error variation because of ADC Counts is very small)
Pressure Calibration Pressure Counts Pressure Sensor: Pressure(Atm)=.0039464(ADC counts)-.002953703 Error=((1.98378e-5*ADC counts)^2+(.002055339)^2)^.5 Atm
Humidity Calibration Humidity Counts Humidity Sensor: RH(%)= 0.4003(ADC count) – .1047 Error: ((0.01453*ADC count)^2+(2.706038)^2)^.5%
Lapse rate averaged over one kilometer RED line is the expected value from US standard atmosphere Tropopause begin 13.6 km (44600 ft.) Tropopause end 18 km (59000 ft)
Clouds • Passed through 3 clouds • Ascent • 1.02 to 1.14 km (3363 to 3763 feet) • 1.18 to 1.23 km (3863 to 4043 feet) • Descent • 0.86 to 0.66 km (2837 to 2150 feet)
Humidity Difference? • 10% difference in humidity between ascent and descent • 20 km mark on ascent and descent • 1 km difference • 37.5 minute difference