Download
1 / 20
200 likes | 230 Views
Redesign starts from user needs: an experience Robbert Renssen (CBS) Wim Kloek (Eurostat). Difference between process description and process design. Process description: describes an existing process in a sequence of steps

E N D
Redesign starts from user needs: an experienceRobbert Renssen (CBS)Wim Kloek (Eurostat)
Difference between process description and process design • Process description: describes an existing process in a sequence of steps • Process design: starts from the user needs, then establishes the relevant sources and bridges the gap between output and input • Gradual scale: maintenance (on the flow), process improvement (given existing output), process redesign (reconsidering existing output), process design (new output)
Generic terminology for describing and designing statistical processes • Objects (the Generic Statistical Information Model, GSIM) • Process steps (the Generic Statistical Business Process Model)
Why do we need generic terminology? • Easier communication between the business, methodologist, IT and designer • Easier exchange of solutions across statistical domains and among countries • The GSIM (Generic Statistical Information Model): describing the ingredients and result • The GSBPM (Generic Statistical Business Process Model): describing the process
GSIM • 1 apple pie (24 cm) • 1/2 cup unsalted butter • 250 gram tablespoons flour • 1/2 cup white sugar • 1/2 cup brown sugar • 8 Granny Smith apples • Springform pan (24 cm) • Oven
GSBPM • Preheat oven to 220 degrees C • Mix flour, butter and sugar to form a paste • Core and slice the apples • Fill springform pan with paste • Fill with apples • Bake about 50 minutes (until apples are soft)
First workshop on to-be state for European ICT statistics (process focus) Involved Eurostat staff (one day) • From the business (about 6 persons involved in different ways in the production of ICT statistics) • From the methodology and quality teams (3 persons) Moderated by a process modeler from DG DIGIT The meeting took place at Eurostat (some current work interference)
Main findings of the first to-be workshop The discussion concentrated on process improvement. The main problem identified was the annual change in the required variables. This requires • An annual legislative procedure • Adaptation of questionnaires • Adaptation of data bases and output tables • Running of a grant programme to buy-in the Member States As a result the up to four annual processes can run in parallel in different phases. Another finding was that the feedback process with the Member States on the validity of results is time consuming.
Reflection on the main findings • Although the findings are perfectly valid • Almost no attention was paid to user needs and available sources (focus on short-run process improvements) • It was decided to have a second to-be workshop at a more strategic level and with a longer run perspective • The user and user needs should be the starting point
Second workshop on to-be state for European ICT statistics (user focus) One day in DG CONNECT (main user, Brussels) • From DG CONNECT one super user • From the EUROSTAT business (about 2 persons; process owners) • From EUROSTAT: a methodologist, an enterprise architect • From Statistics Netherlands: a process designer/architect • From DG DIGIT 2 process modelers Moderated by the process designer from Statistics Netherlands and the Eurostat methodologist Focus was on the user The participants for DG DIGIT assisted in taking notes
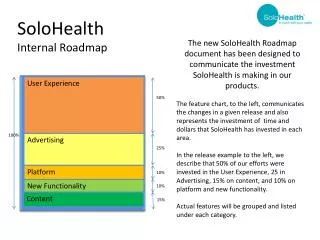
Output: user needs (50%) Input: annotated list of potential sources (20%) Process: happy flow (20%) Introduction and conclusion (10%) Expectation management: Open discussion on needs is not a promise: purpose is to collect information for the preparation of a business case Approach
Are the users well represented? Remedial actions? Free specification Inspired by existing output Indicators (existing, future) Priority order User needs (what do you need the data for; how do you use the data?)
(Statistical) units Target variables Stratifying variables/classifications (level of detail) Microdata/mesodata/indicators Frequency Quality (accuracy, comparability, coherence, timeliness); quality versions Time series versus flexibility Priorities Dimensions of desired output
Main finding on user needs • The ESS is only one of the sources for DG CONNECT, next to administrative sources, own surveys, monitoring (effective speed), internet as a source • The digital agenda scoreboard only half from ESS • Quality of ESS data is derived from the involvement of the national statistical institutes (the data are politically accepted without discussion) • ESS data is used for the calibration of CONNECT surveys • CONNECT surveys are developed (methodologically and conceptually) without much involvement of ESS, whereas the data are often related and sometimes the CONNECT survey is in the end a pilot of a later ESS survey
Other findings • Shift of interest from supply and demand if ICT towards impact (e.g. security, environmental, substitution effects) • Need for data on ICT related issues in specific domains example use in health, labour market, education • CONNECT has a database with 400 largest ICT companies to analyse globalization (not linked with EGR) • Need for microdata on enterprises to allow flexible derivation of new variables • Euro-barometer is used to collect information on opinions, perceptions, awareness and use • Need to connect flow data (e.g. internet as a source) to statistical units
ESS survey on ICT use by households and enterprises ICT related information in other ESS statistics EuroBarometer (?truthfulness) Contracted studies (?truthfullness) Internet as data source Buying data from repositories Secondary sources (national telecom regulators on number of subscriptions) Take-up of eGovernment Inputs (known sources)
Agreement/regulation on data and data quality between Eurostat and MS (how to share the validation process) Agreement for data push and pull with big users (DGs, Agencies, NSIs) see also metadata Need to flexibly derive new variables (microdata to Eurostat), also for previous periods: example application in eSkills Process
Reflection on the workshop with user focus • Very well prepared user, but need to check also other users • One day was sufficient • Intensive meeting; no more than 7 to10 participants • Need for clear moderation • Need for documentation of results and verification on the spot • Not useful to discuss the process with the user; the point can just focus on data access • Many strategic considerations on the role of official statistics in knowledge based decision making
Identify key users and user needs Start with priority output with sources What is the gap between input and output? What functions are needed to bridge the gap (no more detailed than 2 digit GSBPM) Choose specific methodology Describe the happy flow (ignoring data problems/feedback loops) and resources Identify restrictions, risks, costs Process design approach
Brainstorming in preparation of process improvement and redesign require different groups (Re)design starts from user needs The discussion generates questions on the role of official statistics: on earlier collaboration on studies and surveys; integration and maintenance of data bases The perceived quality of ESS statistics is not so much in the quality dimensions, but in the collaborative process Conclusions