Download
1 / 18
180 likes | 486 Views
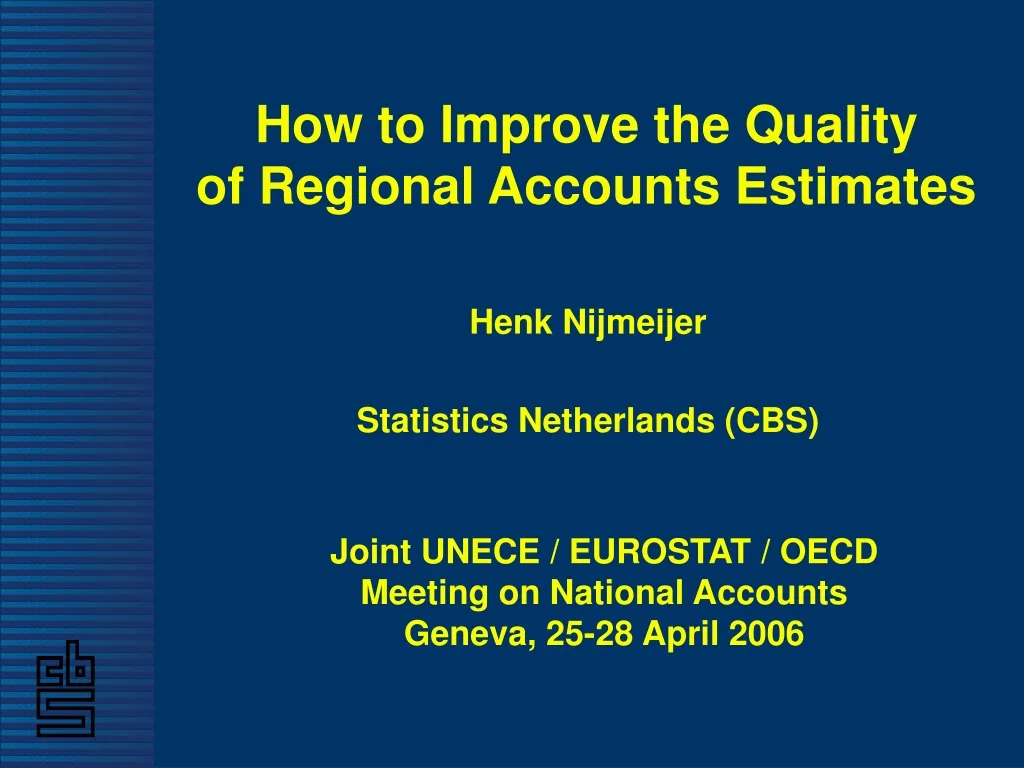
How to Improve the Quality of Regional Accounts Estimates. Henk Nijmeijer Statistics Netherlands (CBS) Joint UNECE / EUROSTAT / OECD Meeting on National Accounts Geneva, 25-28 April 2006. Structure of the presentation. Introduction Quality Quality of regional accounts estimates

E N D
How to Improve the Quality of Regional Accounts Estimates Henk Nijmeijer Statistics Netherlands (CBS) Joint UNECE / EUROSTAT / OECD Meeting on National AccountsGeneva, 25-28 April 2006
Structure of the presentation • Introduction • Quality • Quality of regional accounts estimates • Organisation • Process tables • Conclusions and recommendations
Introduction • Gross value added and GDP per region • Administrative use of regional accounts • Accuracy • Connection with national estimates
Quality • Dimensions of quality • Accuracy and comparability • Shift from output to process
Quality of regional accounts estimates • Quality project • Concepts • Framework • Sources and methods • Transparency
Organisation of regional accounts • Central! • National accounts estimates: invariable • Regional accounts in relation to NA • Economic reality
Economic reality and regional accounts Economic reality Confrontation Regional accounts estimates
Process tables • GNI Committee • Sources and adjustments
Basis for NA figures - surveys & censuses - administrative data - extrapolation & models - other Adjustments - data validation adjustments - conceptual adjustments - exhaustiveness adjustments - balancing adjustments Basis for NA figures+Adjustments= Final Estimate
equal equal GDP Production measure GDP Expenditure measure GDP Income measure Transformed into Gross National Income
Process tables • GNI Committee • Sources and adjustments • Regional process tables • Dutch experiences
INPUT STORAGE / PROCESSING OUTPUT Classifica-tions:- Regions- Industries Data:- Years- Regions (53)- Industries (118)- Variables (6) - Publication (StatLine)- Questionnaire Eurostat National totals (NA) Process tables Process:- Link- Multi-regionalise- Regionalise- Gross up Data:- Business statistics- Labour statistics Micro-data Corrections Dutch RA production process
Conclusions and recommendations • Administrative use of regional accounts:increased interest of accuracy • Update ESA95: review RA chapter • RA inventory needed • Process table: several purposes • Closer cooperation RA & NA