Download
1 / 19
190 likes | 279 Views
Zasova L.V., Shakun A.V. , Khatuntsev I.V., Ignatiev N.I,(1,2), Brekhovskih U.A.(1), Piccioni G.(3), Drossart P.(4). (1) IKI RAS, Moscow, (2) MIPT, Dolgoprudny, Russia, (3) lAPS-INAF, Rome, Italy, (4) LESIA, Meudon, France.

E N D
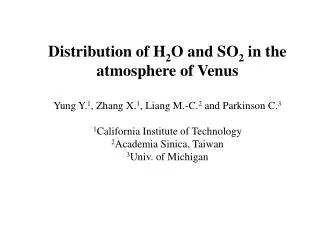
Zasova L.V., Shakun A.V. , Khatuntsev I.V., Ignatiev N.I,(1,2), Brekhovskih U.A.(1), Piccioni G.(3), Drossart P.(4).(1) IKI RAS, Moscow, (2) MIPT, Dolgoprudny, Russia,(3) lAPS-INAF, Rome, Italy, (4) LESIA, Meudon, France O2 night airglow in Venus atmosphere and dynamics around 100 km from VIRTIS-M VEX MS3, 3-12.10.2012
O2 Venus night airglow as a tracer of circulation near mesopause O + O + CO2 --> O2* + CO2 + 5.17 eV - recombination O2* --> O2 + hv - de-excitation O2* + M --> O2 + M - quenching Subsolar-to-antisolar circulation (SS - AS) in thermosphere Retrograde zonal superrotation (RZS) in mesosphere
Examples of the O2 vertical profiles H,km W/m2/m/sr Volume emission rate 1,2 (black,red) –limb spectra – only O2 emissions bands. 3-4 (green, blue) – on the disk of the planet, peaks of thermal emission of low atmosphere and surface. 1.27 µm peak is a superposition of the non-LTE O2 and thermal emissions. Max O2 -1.269 µm , max thermal radiation – 1.277 µm VIRTIS-M is mapping spectrometer with spectral range 0.3 -5.1 µm. Spectral resolution in IR of 0.016 µm at 1.27 µm . Two modes of work – nadir and limb. Data – cubes: two coordinates of point + spectrum
Equation for the O2 intensity calculation: Thermal emission Intensity at 1.27 µm – MR units conversion coefficient - VIRTIS-M measured spectral intensity – Lambert cloud albedo (Crisp et al. [1996]) – aspect ratio 1.27 /1.18 of thermal emission of the atmosphere – path in the layer – path in the layer
It was chosen 27 areas without visible O2 emission. They occur in the range of surface altitudes from -2 km to +2.5 km. Measured spectra were corrected for errors, not taken into account in calibration procedure. Spectra for these areas were fitted by modeled ones by variation of clouds opacity and the H2O mixing ratio. Surface elevation was taken from Magellan data. Example of fitting spectra.Measured (triangles) and synthetic spectra (solid line), orbit 320
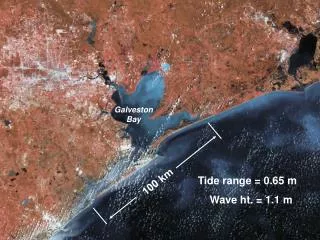
The importance to take into account altimetry The O2 emission distribution with k=const. Artifacts due to surface elevation features are seeing in the O2 distribution The O2 emission distribution with k=k(h). Artifacts disappeared. Magellan altimetry
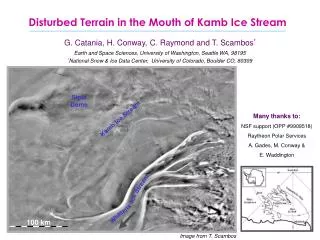
φ° MAPS of theO2 1.27 μm night airglow Orbit 66 (data cubes 00, 01) Maximum emission at AS area Subsolar-antisolar flow Orbit 82 (data cubes 00,01,03) Maximum at 22 h shifted in opposite direction to RZS RZS φ° φ° Orbit 108-01, 121-01 Maximum at 2-3 h in equatorial region RZS with up to 60 m/s φ° 0 -20 -40 6MR Orbit 319 (data cubes 01,02) Maximum emission at 23 h at equator shifted in opposite direction to RZS (X-axis –local time, unique for all plots)
321 (00,01) Two maxima: φ = 5°, LT = 0h, 6 MR φ = -30°, LT = 23 h, 4.5 MR RZS 351 (00 -05) Two symmetrical maxima 367 (02) Several maxima 1-2.5 h, 4-6 MR RZS up to 60m/s 6MR Orbit 380 (01-11) LT = -3 ÷ 3h No symmetry
388 (09-14) 505 (01-03) 390 (04-13) 565 (04,06,12,14) 567(04,06,08,12,14) RZS 569 (04,06,08,10,12,14)
579 (00,04,06,08,10,12) 591 597 593 (00-08) (02,03) 579 (00,04,06,08,10,12,14) RZS 598 (00-06)
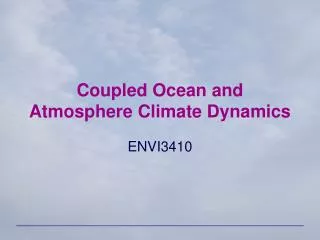
MAP of the O2(a1∆g) airglow based on 718 orbits Intensity , MR Number of orbits Zonal wind Latitude Latitude Only measurements with exposure ≥ 3 s were used to avoid noisy data (left). Corresponding number of orbits for averaging at each point (right). Iav = 0.35±0.3 MR
RZS Intensity of the O2 airglow vs. local time for different latitudinal zones, averaged over 10 ° latitude and 2h local Mean intensity on the evening side is 0.43 MR Mean intensity on the morning side is 0.26MR
RZS H, km Vertical emission rate, MR Volume emission rate W/m2/m/sr Local time, h Limb data . Averaged over 10 deg. of latitude and 2h of local time At latitude < 40 N maximum of emission is found after midnight, and it may be an effect of zonal retrograde superrotation, at φ > 50N maximum of intensity of O2 airglow is before midnight and minimum after midnight. I =0.45±0.36 MR, Hpeak=97 ± 3km,Half-width= 8 ± 3 km
Krasnopolsky (2010), photochemical model, based on 64 reactions 4πIO2 = 0.158 (ΦO/1012)1.14 MR Observed O2 nightside-mean airglow intensity of 0.35 MR requires the O atoms flux of 2.2·1012cm-2 s-1 Maximum of 6 MR – 2.4·1013 cm-2 s-1 According to Krasnopolsky (2010), the dayside-mean production of O by photolysis of CO2 above 80 km is 6.4 - 7.0 ·1012cm-2 s-1 at low and high solar activity, respectively. It is concluded that the model support the observations of the O2 1.27 µm nightglow with mean intensity less than 1 MR
Thermal tides (Venera-15, Zasova et.al 2007) Amplitudes of diurnal (T1 )and simi-diurnal (T2) exceed 5K between 85-100 km at low latitudes Gravity waves (Altieri et al. this session)
Pioneer Venus SPICAV/VEX NO – maximum emission around 2h (PV, and PICAV). RZS above 100 km is important , up to 60m/s - Brecht et al. (2011)
Map of the O2 emission intensity(MR) and horizontal wind speed (arrows) –top Horizontal divergence in 10-6 S-1 – bottom panel
SUMMARY • Circulation at mesopause is combination of SS-AS, zonal superrotation and waves activity, relative importance of all components is time variable • In the map (averaged over 718 orbits) emission maximum is observed at low latitudes, around midnight (20N - 20S, LT=22h- 3h, without absolute maximum in antisolar point) for both nadir and limb measurements • At individual maps a maximum intensity may be found in the range of local time -4h - +4h. Shift of maximum emission to morning terminator may be connected to superposition of SS-AS and RZS. Opposite shift we don’t understand. Sometimes symmetrical behaviors vs. local time is observed Wave activity also may be responsible for deviation of the O2 distribution from the case SS-AS. • Low intensity near terminators as well as wide spot of higher intensity around midnight (on average map) indicate on wind flows through terminators from the day side. SS-AS is important mode of circulation • Comparison with NO night glow distribution (with map, obtained by Pioneer-Venus) show both correlation in some cases and anticorrelation in others. • O2 and NO emissions are related to different layers in the atmosphere • To explain observed maps of the O2 emission it needs GCM for mesosphere with included photochemistry
Вертикальное распределение эмиссии O2 (a1∆g): Интенсивность эмиссии: 0.45 ± 0.36МРл Высота максимума эмиссии: 97 ± 3км Ширина профиля на половине максимума эмиссии: 8 ± 3км