Download
1 / 1
10 likes | 140 Views
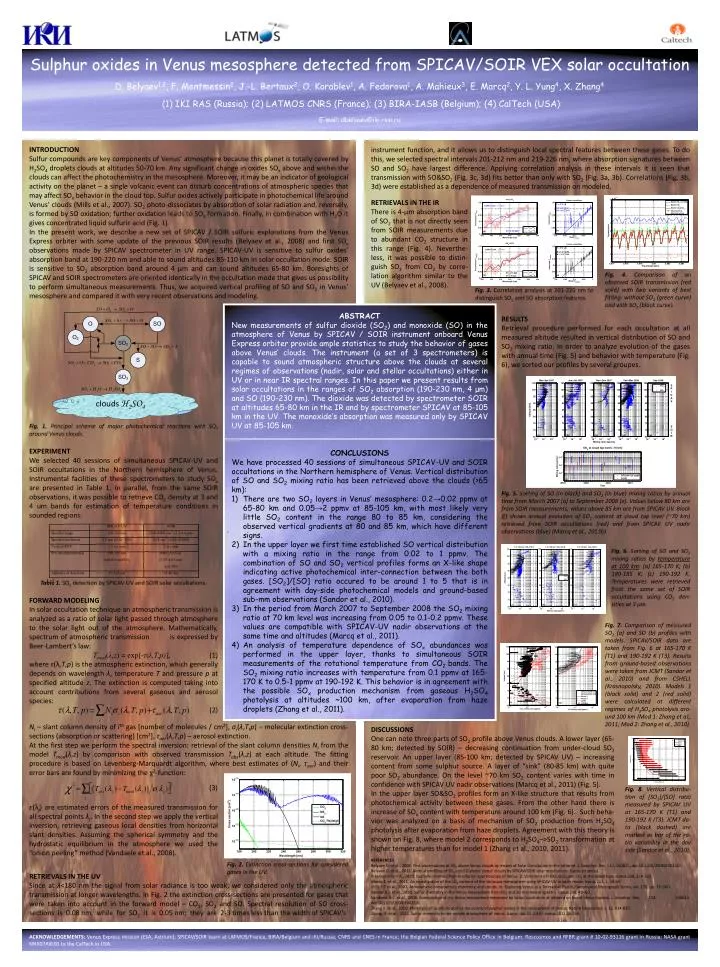
clouds H 2 SO 4. Sulphur oxides in Venus mesosphere detected from SPICAV /SOIR VEX solar occultation D. Belyaev 1, 2 , F. Montmessin 2 , J.-L. Bertaux 2 , O. Korablev 1 , A. Fedorova 1 , A. Mahieux 3 , E. Marcq 2 , Y. L. Yung 4 , X. Zhang 4

E N D
cloudsH2SO4 Sulphur oxides in Venus mesospheredetectedfromSPICAV/SOIR VEX solaroccultation D. Belyaev1,2, F. Montmessin2, J.-L. Bertaux2,O. Korablev1, A. Fedorova1, A. Mahieux3,E. Marcq2, Y. L. Yung4, X. Zhang4 (1) IKI RAS (Russia); (2) LATMOS CNRS (France); (3) BIRA-IASB (Belgium); (4) CalTech (USA) E-mail: dbelyaev@iki.rssi.ru INTRODUCTION Sulfurcompounds are key components of Venus’atmospherebecausethisplanetistotallycoveredby H2SO4 droplets clouds at altitudes 50-70 km. Anysignificantchange in oxidesSOxabove and withinthe cloudscan affect the photochemistry in themesosphere. Moreover, itmaybe an indicatorofgeologicalactivity on the planet – a single volcaniceventcandisturb concentrations of atmosphericspeciesthatmay affect SOxbehavior in the cloudtop.Sulfuroxidesactivelyparticipate in photochemicallife around Venus’ clouds (Mills et al., 2007). SO2photo-dissociates by absorption of solar radiation and,reversely, isformed by SO oxidation; furtheroxidationleads to SO3 formation. Finally, incombinationwith H2O itgivesconcentratedliquidsulfuricacid(Fig. 1). In the presentwork, wedescribe a new set of SPICAV / SOIR sulfuric explorations from the Venus Express orbiter withsome update of the previousSOIR results(Belyaev et al., 2008) and first SOx observations made by SPICAV spectrometer in UV range. SPICAV-UV is sensitive to sulfuroxides’ absorption band at 190-220 nm and able to sound altitudes 85-110 km in solar occultation mode. SOIR is sensitive to SO2 absorption band around 4 μm and cansound altitudes 65-80 km. Boresights of SPICAV and SOIR spectrometers are orientedidentically in the occultation mode thatgives us possibility to performsimultaneousmeasurements. Thus, weacquired vertical profiling of SO and SO2 in Venus’ mesosphere and compareditwithveryrecent observations and modeling. instrument function, and itallows us to distinguish local spectral featuresbetweenthesegases.To do this, we selected spectral intervals 201-212 nm and 219-226 nm, where absorption signatures between SO and SO2 have largest difference. Applying correlation analysis in these intervals it is seen that transmission with SO&SO2 (Fig. 3c, 3d) fits better than only with SO2 (Fig. 3a, 3b). Correlations (Fig. 3b, 3d) were established as a dependence of measured transmission on modeled. RETRIEVALS IN THE IR There is 4-μm absorption band of SO2thatis not directlyseenfrom SOIR measurements due to abundant CO2 structure in this range (Fig. 4). Neverthe-less, itwas possible to distin-guish SO2from CO2 by corre-lationalgorithmsimilar to the UV (Belyaev et al., 2008). Fig. 4. Comparison of an observed SOIR transmission (red solid) with two variants of best fitting: without SO2 (green curve) and with SO2 (black curve). Fig. 3.Correlation analysis at 201-226 nm to distinguish SO2 and SO absorption features. ABSTRACT New measurements of sulfurdioxide (SO2) and monoxide(SO) in the atmosphere of Venus by SPICAV / SOIR instrument onboard Venus Express orbiter provide ample statistics to studythe behaviorof gasesabove Venus’ clouds. The instrument (a set of 3 spectrometers) is capable to soundatmospheric structure above the cloudsatseveralregimes of observations (nadir, solarand stellaroccultations) either in UV or in nearIR spectral ranges. In thispaperwepresentresultsfromsolaroccultations in the ranges of SO2absorption (190-230 nm, 4 μm) and SO (190-230 nm). The dioxide was detected by spectrometer SOIR at altitudes 65-80 km in the IR and by spectrometer SPICAV at 85-105 km in the UV. The monoxide’s absorption was measured only by SPICAV UV at 85-105 km. CONCLUSIONS We have processed 40 sessions of simultaneous SPICAV-UV and SOIR occultations in the Northern hemisphere of Venus. Vertical distribution of SO and SO2 mixing ratio has been retrieved above the clouds (>65 km): There are two SO2 layers in Venus’ mesosphere: 0.2→0.02 ppmv at 65-80 km and 0.05→2 ppmv at 85-105 km, with most likely very little SO2 content in the range 80 to 85 km, considering the observed vertical gradients at 80 and 85 km, which have different signs. In the upper layer we first time established SO vertical distribution with a mixing ratio in the range from 0.02 to 1 ppmv. The combination of SO and SO2 vertical profiles forms an X-like shape indicating active photochemical inter-connection between the both gases. [SO2]/[SO] ratio occured to bearound 1 to 5 thatis in agreement withday-sidephotochemicalmodels and ground-basedsub-mm observations (Sandor et al., 2010). In the period from March 2007 to September 2008 the SO2 mixing ratio at 70 km level was increasing from 0.05 to 0.1-0.2 ppmv. These values are compatible with SPICAV-UV nadir observations at the same time and altitudes (Marcq et al., 2011). An analysis of temperature dependence of SOx abundances was performed in the upper layer, thanks to simultaneous SOIR measurements of the rotational temperature from CO2 bands. The SO2 mixing ratio increases with temperature from 0.1 ppmv at 165-170 K to 0.5-1 ppmv at 190-192 K. This behavior is in agreement with the possible SOx production mechanism from gaseous H2SO4 photolysis at altitudes ~100 km, after evaporation from haze droplets (Zhang et al., 2011). RESULTS Retrievalprocedureperformed for each occultation at all measured altitude resulted in vertical distribution of SO and SO2mixing ratio. In order to analyzeevolution of the gaseswithannual time (Fig. 5) and behaviorwithtemperature (Fig. 6), wesortedour profiles by several groupes. Fig. 1. Principal scheme of major photochemical reactions with SO2 around Venus clouds. EXPERIMENT Weselected 40 sessions of simultaneous SPICAV-UV and SOIR occultations in the Northernhemisphere of Venus. Instrumental facilities of thesespectrometers to studySOx are presented in Table 1. In parallel, from the same SOIR observations, itwas possible to retrieve CO2densityat 3 and 4 um bands for estimation of temperature conditions in soundedregions. Fig. 5.Sorting of SO (in black) and SO2 (in blue) mixing ratios by annual timefrom March 2007 (a) to September 2008 (e). Values below 80 km are from SOIR measurements; values above 85 km are from SPICAV UV. Block (f) shows annual evolution of SO2 content at cloud top level (~70 km) retrieved from SOIR occultations (red) and from SPICAV UV nadir observations (blue) (Marcq et al., 2011b). Fig. 6.Sorting of SO and SO2mixing ratios by temperature at 100 km: (a) 165-170 K; (b) 180-185 K; (c) 190-192 K.Temperatures were retrieved from the same set of SOIR occultations using CO2 den-sities at 3 μm. Table 1. SOxdetection by SPICAV UV and SOIR solar occultations. FORWARD MODELING In solar occultation technique an atmospheric transmission isanalyzedas a ratio of solar light passed through atmosphere to the solar light out of the atmosphere. Mathematically, spectrum of atmospheric transmission is expressed by Beer-Lambert’s law: Tmod(λ,z) = exp[-τ(λ,T,p)], (1) where τ(λ,T,p) is the atmospheric extinction, which generally depends on wavelength λ, temperature T and pressure p at specified altitude z. The extinction is computed taking into account contributions from several gaseous and aerosol species: (2) Fig. 7.Comparison of measured SO2 (a) and SO (b) profiles with models. SPICAV/SOIR data are taken from Fig. 6 at 165-170 K (T1) and 190-192 K (T3). Results from ground-based observations were taken from JCMT (Sandor et al., 2010) and from CSHELL (Krasnopolsky, 2010). Models 1 (black solid) and 2 (red solid) were calculated at different regimes of H2SO4 photolysis aro-und 100 km (Mod 1: Zhang et al., 2011; Mod 2: Zhang et al., 2010). Ni – slant column density of ith gas [number of molecules / cm2], σi(λ,T,p) – molecular extinction cross-sections (absorption or scattering) [cm2], τaer(λ,T,p) – aerosol extinction. At the first step we perform the spectral inversion: retrieval of the slant column densities Ni from the model Tmod(λ,z) by comparison with observed transmission Tobs(λ,z) at each altitude. The fitting procedure is based on Levenberg-Marquardt algorithm, where best estimates of (Ni, τaer) and their error bars are found by minimizing the χ2-function: (3) DISCUSSIONS One can note three parts of SO2 profile above Venus clouds. A lower layer (65-80 km; detected by SOIR) – decreasing continuation from under-cloud SO2 reservoir. An upper layer (85-100 km; detected by SPICAV UV) – increasing content from some sulphur source. A layer of “sink” (80-85 km) with quite poor SO2 abundance. On the level ~70 km SO2 content varies with time in confidence with SPICAV UV nadir observations (Marcq et al., 2011) (Fig. 5). In the upper layer SO&SO2 profiles form an X-like structure that results from photochemical activity between these gases. From the other hand there is increase of SOx content with temperature around 100 km (Fig. 6). Such beha-vior was analyzed on a basis of mechanism of SO2 production from H2SO4 photolysis after evaporation from haze droplets. Agreement with this theory is shown on Fig. 8, where model 2 corresponds to H2SO4–>SO2 transformation at higher temperatures than for model 1 (Zhang et al., 2010, 2011). Fig. 8. Vertical distribu-tionof [SO2]/[SO] ratio measured by SPICAV UV at 165-170 K (T1) and 190-192 K (T3). JCMT da-ta (black dashed) are marked as bar of the ra-tiovariability in the day side (Sandor et al., 2010). ε(λj) are estimated errors of the measured transmission for all spectral points λj. In the second step we apply the vertical inversion, retrieving gaseous local densities from horizontal slant densities. Assuming the spherical symmetry and the hydrostatic equilibrium in the atmosphere we used the “onion peeling” method (Vandaele et al., 2008). REFERENCES Belyaev D. et al., 2008. First observations of SO2 above Venus clouds by means of Solar Occultation in the Infrared. J. Geophys. Res. 113, E00B25, doi:10.1029/2008JE003143. Belyaev D. et al., 2011. Vertical profiling of SO2 and SO above Venus' clouds by SPICAV/SOIR solar occultations. Icarus (in press). Krasnopolsky V.A., 2010. Spatially-resolved high-resolution spectroscopy of Venus. 2. Variations of HDO, OCS, and SO2 at the cloud tops. Icarus 209, 314-322. Marcq E. et al., 2011. An investigation of the SO2 content of the Venusian mesosphere using SPICAV-UV in nadir mode. Icarus 211, 1, 58-69. Mills F.P. et al., 2007. Atmospheric composition, chemistry, and clouds. In: Exploring Venus as a Terrestrial Planet, Geophysical Monograph Series, vol. 176, pp. 73–100. Sandor B.J. et al., 2010. Sulfur chemistry in the Venus mesosphere from SO2 and SO microwave spectra. Icarus 208, 49–60. Vandaele A.C. et al., 2008. Composition of the Venus mesosphere measured by Solar Occultation at Infrared on board Venus Express. J. Geophys. Res. 113. E00B23. doi:10.1029/2008JE003140. Zhang X.et al., 2010. Photolysis of sulphuric acid as the source of sulphur oxides in the mesosphere of Venus. Nature Geoscience 3, 12, 834-837. Zhang, X. et al., 2011. Sulfurchemistry in the middle atmosphere of Venus.Icarus. doi:10.1016/j.icarus.2011.06.016. Fig. 2. Extinction cross-sections for considered gases in the UV. RETRIEVALS IN THE UV Since at λ<180 nm the signal from solar radiance is too weak, we considered only the atmospheric transmission at longer wavelengths. In Fig. 2 the extinction cross-sections are presented for gases that were taken into account in the forward model – CO2, SO2 and SO. Spectral resolution of SO cross-sections is 0.08 nm, while for SO2itis0.05 nm; they are 2-3 times lessthan the width of SPICAV’s ACKNOWLEDGEMENTS: Venus Express mission (ESA, Astrium); SPICAV/SOIR team at LATMOS/France, BIRA/Belgium and IKI/Russia; CNRS and CNES in France; the Belgian Federal Science Policy Office in Belgium; Roscosmos and RFBR grant # 10-02-93116 grant in Russia;NASA grant NNX07AI63G to the CalTech in USA.