Download
1 / 58
600 likes | 623 Views
Universidad Complutense de Madrid Facultad de Ciencias Físicas Dpto. de Física Atómica, Molecular y Nuclear. Grupo de Física Nuclear. Programa de Doctorado de Física Nuclear. Defensa de Tesis Doctoral. SIMULATION AND IMAGE RECONSTRUCTION OF CLINICAL TOF-PET SCANNERS. Khaled Abushab.

E N D
Universidad Complutense de Madrid Facultad de Ciencias Físicas Dpto. de Física Atómica, Molecular y Nuclear Grupo de Física Nuclear Programa de Doctorado de Física Nuclear Defensa de Tesis Doctoral SIMULATION AND IMAGE RECONSTRUCTION OF CLINICAL TOF-PET SCANNERS Khaled Abushab Advisors: Dr. José Manuel Udías Moinelo Dr. Joaquín López Herraiz 22 Feb. 2013 1
Table of contents • Introduction and Objectives • Simulation of clinical PET scanners • Image reconstruction • Conclusions 2
Table of contents • Introduction and Objectives • Simulation of clinical PET scanners • Image reconstruction • General Conclusions 3
1.Introduction and Objectives Positron Emission Tomography (PET) • PET is a nuclear medicine imaging technique that produces a 3D image of functional processes in the body. • It is a key diagnostic imaging modality used largely in determining the presence and severity of cancers, neurological conditions, and cardiovascular diseases. Hicks et al., (2012) Nat Rev Clin Oncol 9, 712-720 Fenskeet al., (2008) Nat Clin Prac Oncol 5, 677-681 Gould et al., (2007) J Nucl Med 48, 1112–1121 4
1.Introduction and Objectives PET Scanners • Scanner- to perform the clinical exam • Includes a computer running algorithms for tomographic reconstruction & display • Cyclotron - to produce the positron-emitter (radionuclide) • Radiopharmacy- to produce the labeled molecule 5
1.Introduction and Objectives p+ LOR 18F 18O n Glucosa PET Procedure 18O(p,n)18F LOR = 0 = 0 FDG 6
1.Introduction and Objectives Physics of PET Photon 511 keV Photoelectric effect annihilation non-colinearity Positron Range Radioisotope Klein-Nishina Photon 511 keV Compton effect PET Scanner PET Scanner 7
1.Introduction and Objectives CT Recon PET Recon PET/CT scan protocol CT PET Fusion Fusion (PET/CT) 8
1.Introduction and Objectives Challenges for next generation PET scanners Developments in PET technology aim to provide: • Better images (more accurate information of the distribution of the radiotracer in the body) • In shorter scanning and reconstruction time • leaving lowerradiation dose in the patient • Using more affordable scanners Improving one aspect may worsen some other In order to improve current PET scanners, it is neccesary to be able to evaluate precisely the impact of new technology in all these different aspects.
1.Introduction and Objectives Table of contents Simulation of clinical PET scanners Image reconstruction
1.Introduction and Objectives Monte Carlo simulation in PET • Methods in which all processes related to the experimental system under study are modelled in a computer. • The name Monte Carlo (MC) is used because often random numbers processesare employed to generate simulated events. • Because nuclear medicine imaging deals with the emission of radiation energy, MC simulations of radiation emission and detection are an important tool for research and development of PET scanners. • MC simulations are widely used for PET aiming to take into account all the processes involved in PET imaging. • MC simulations have been proven to be a useful tool to study performance characteristics and parameters that cannot be measured experimentally. 11
1.Introduction and Objectives Monte Carlo simulation in PET • Applications: • Scanners design • Data Processing • Data Correction • Image Reconstruction • Some existing codes: • SimSET [Harrison et al., 1993] • GATE [Jan et al., 2004](GEANT4) • Eidolon [Zaidi and Scheurer, 1999] (MCNP) • PETSIM [Thompson et al., 1992] • GAMOS [Arce et al., 2008](GEANT4) • PeneloPET [España et al., 2009](PENELOPE) 12
1.Introduction and Objectives PeneloPET • PeneloPET[1], is a Monte Carlo simulator for PET scanner based on PENELOPE [2]. • PENELOPE • Penelope is a code for the Monte Carlo simulation, it describes the transport and the interaction of electrons, gammas and positrons, in matter. • Energies range from a few hundred eV to 1 GeV (suits well PET needs). • Robust, fast and accurate (used in dosimetry and radiotherapy). [1] S España et al (2009) Phys Med Biol, 54, 1723-1742 [2] Salvat et al (2008) PENELOPE-2008: A code system for Monte Carlo simulation of electron and photon transport. 13
1.Introduction and Objectives Objectives The main objective of this thesis is to extend the capabilities of the tools developed in our group (GFN) for PET imaging, so far intended for the preclinical arena, to clinical settings, and to validate these tools against clinical measurements 14
Table of contents Simulation of clinical PET scanners Image reconstruction 15
2. Simulation of clinical PET scanners Characterizations of clinical scanners • ThreeBiograph PET Scanners • Biograph TruePoint (B-TP) • Biograph TruePoint with TrueV (B-TPTV) • Biograph mCT PET/CT (mCT) B-TPTV Siemens Data sheet 16
2. Simulation of clinical PET scanners • Unknown Information • Some minor details of the geometry of the scanner. • Materials (bed, shielding and covers). • Detailed behavior of the acquisition electronics. • How to deal with the unknown • B-TPTV has been taken as a reference to tune some of the parameters of the simulations. • Published experimental values of the B-TPTV have been used as reference (sensitivity, NEC, spatial resolution and TOF). 17
2. Simulation of clinical PET scanners Sensitivity • The sensitivity of a PET scanner quantifies the ability of a scanner to detect the coincident photons emitted from inside the FOV. • Reflector thickness? • Parameters employed Detector elements/block (4×4×20mm3) 19
2. Simulation of clinical PET scanners Sensitivity • NEMA [3] protocol • A line source (70 cm), low activity (3.9 MBq). • Dead time loss <1% and random <5%. • Sensitivity at 2 transaxial position (0 and 10 cm) was obtained. source Interaction in the crystals [3] National Electrical Manufacturers Association (2007) NEMA standards publication NU 2-2007 20
2. Simulation of clinical PET scanners Sensitivity Energy window >(425-650 KeV), Time window >(4.5 ns) • The use of a reflector thickness of the order of 0.4 mm yields good agreement with the measured sensitivity. • This reflector thickness was employed in all simulations in this work. [4] Eriksson et al., (2007) Nuc Inst and Meth in Phy Res Sec A 580, 836–842 [5] Jacoby et al., (2009) Trans Nucl Sci 56, 633–639. [6] Jacoby et al., (2011) Phy Med Biol 56, 2375–2389 21
2. Simulation of clinical PET scanners Scatter fraction (SF) • The proportion of accepted coincidences which have undergone Compton scattering prior to detection is called scatter fraction (SF). • The SF is a critical component of the NEC rate computation, and in our work it is a genuine prediction of the simulations, no parameters have been fitted to reproduce it. • The SF was measured from low activity simulations, where random counts are negligible . • Its used as a golden measure to optimize timing and energy windows. 22
2. Simulation of clinical PET scanners Scatter fraction (SF) • Simulated and experimental values of SF are within 4%. • It remains fairly constant for all the scanners simulated. 23
2. Simulation of clinical PET scanners Noise equivalent count (NEC) rate • NEC is a global measure, taking into account scatter and random coincidences, of the scanner ability to acquire useful counts. • It describes the effective number of counts measured by PET scanner as a function of activity in the FOV. T > True coincidence count rate S > Scatter coincidence R > Random coincidence 24
2. Simulation of clinical PET scanners Noise equivalent count (NEC) rate • NEMA protocol • Initial activity (1.04 GBq 18F ). • Data simulated for 35 frames. • NEC plotted as a function of activity. • PeneloPET includes simulation of acquisition electronics • Singles dead time > applied to every photon that reaches the scanner. • Coincidences dead time > further dead time involved in the processing of events identified as coincidences. • Integration time > pile-up (and pile-up rejection) effects. 25
2. Simulation of clinical PET scanners Noise equivalent count (NEC) rate 161@34.5 • 873 kcps @ 46 • 804 kcps @ 38 26
2. Simulation of clinical PET scanners Sensitivity (extended rings) • sensitivity increased 6 times > BTPTV 40% 27
3. Simulation of clinical scanners with PeneloPET NEC (extended rings) 28
2. Simulation of clinical PET scanners Spatial resolution • The spatial resolution of a PET scanner represents its ability to disentangle two close point sources. • Acquisition methods • Filtered back projection reconstruction of sinogram data into images with 336 × 336 × 109 voxels (voxel size of 2 mm) • NEMA protocol 29
2. Simulation of clinical PET scanners Spatial resolution • The experimental reconstructed image size was 336 x 336 x 109 with a voxel size of 2 mm 30
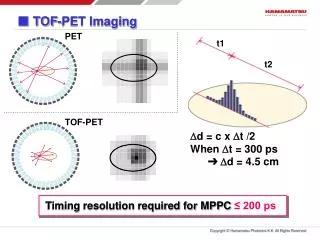
2. Simulation of clinical PET scanners Time of flight (TOF) PET scanners • principle of operation • TOF-PET systems exploit the time difference between the two emitted photons to improve the location of the annihilation position along LOR. • The measured time difference is used by the reconstruction algorithm to locate the annihilation point Dx inside the LOR (Dx =c Dt/2). PET traditional The probability for the event to be located along the LOR is uniform t2 t2-t1 t1 PET Time-of-Flight The most likely position has to be compatible with the measured TOF value 31
2. Simulation of clinical PET scanners TOF has been incorporated in PeneloPET • With no additional time jitter, we obtain a FWHM in the time spectrum of about 53 ps, in agreement with what is expected from the effective size, due to positron range effects in water, of a 18F source. FWHM = 550 ps Measured time distribution [7] • Simulated TOF distribution from a centered source. • An additional time jitter of 170 ps is introduced in the simulations to produce a TOF resolution of 550 ps (FWHM) for the B-TPTV scanner. [7] Jacoby et al., (2008) Conference record, NSS’08.IEEE 3738-3743 32
2. Simulation of clinical PET scanners Conclusion • PeneloPET is flexible enough to easily accommodate different parameters in the simulations. • Good agreement between simulations and experiment can be obtained. • PeneloPET is suitable for simulating and investigating clinical systems. 33
Table of contents Simulation of clinical PET scanners Image reconstruction 34
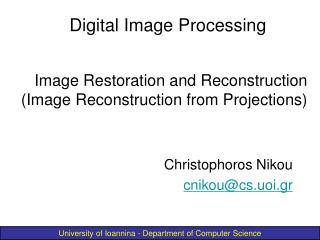
3.Image reconstruction Analytical and iterative methods • The basic role of image reconstruction is to convert the measured counts at projections with many different angles around the object, into an image that reflects in a quantitative way the distribution of positron-emitting atoms. • There are two main approaches to image reconstruction. 35
3.Image reconstruction Iterative method Based on statistical methods Require a system model Analytical and iterative methods Based on the formalism of computed tomography that relates line integral measurements to the activity distribution in the object. It does not model the physics in detail. Analytical method (FBP) The data collection process in a PET scanner is modeled in some detail. In a series of successive iterations, the image that is most consistent with the measured data is obtained. 36
3.Image reconstruction ESTIMATED DATA PROJECTION PROJECTION ESTIMATED DATA ESTIMATED DATA ESTIMATED OBJECT Iterative method INITIAL OBJECT (uniform) SYSTEM MODEL PET DATA INITIAL OBJECT (uniform) Based on statistical methods SYSTEM MODEL SYSTEM MODEL PET DATA PET DATA BACK-PROJECTION Requires a system model Analytical and iterative methods Analytical method (FBP) SIMPLESYSTEM MODEL IMAGE BACK-PROJECTION FILTER PET DATA 37
3.Image reconstruction GFIRST-GPU GFIRST-GPU • GFIRST is an implementation of FIRST (Fast Iterative Reconstruction Software for (PET) tomography) code [8] developed by our group. • It is implemented in CUDA (Computer Unified Device Architecture). • GFIRST was designed to work with sinograms. • This part of the thesis aims to demonstrate that GFIRST can incorporate TOF information, and to investigate with the help of realistic simulations the gain in image quality that can be achieved using TOF in different situations. [8] Herraiz et al., 2006 Phys Med Biol, 51, 4547–4565 38
3.Image reconstruction GFIRST Improvements • Point Spread Function (PSF) • Blurring effects in PET such as positron-range, non-collinearity of the gamma rays, limit the maximum resolution achievable in reconstructed PET images. • In order to improve the reconstruction method and to increase the convergence rate of the algorithm, a PSF was used to model the physics blurring effects in the reconstruction. FWHM of PSF PSF 39
3.Image reconstruction GFIRST Improvements • Median filter and TOF • We extended GFIRST to include median filter regularization. • In this case, after every iteration, the image is smoothed by applying a penalty to those voxels which deviate significantly from their neighbours. • GFIRST was extended to incorporate TOF information. GFIRST was initially developed for non-TOF sinogram reconstructions. 40
3.Image reconstruction Effect of TOF in image quality • Methods andmaterials • PET scanner • The scanner employed for the simulation was the B-TPTV PET/CT. The TOF resolution of this system is 550 ps. 55 mm • Image quality phantom 10 mm 13 mm • The NEMA image quality phantom was used. 17 mm 37 mm 22 mm 28 mm • Sinograms • In PeneloPET, sinograms corresponding to different combinations of rings in which each of the gamma ray has been detected are grouped together using Michelograms. 41
3.Image reconstruction Effect of TOF in image quality • Methods and materials • TOF Sinograms • TOF information is encoded in the list-mode data with time bins of 78 ps. The data is later reorganized into sinograms with 312 ps time bins, four bins of 78 ps are added to form the 312 ps bins. • A TOF sinogram with 13 TOF bins (each 312 ps wide) covering a total of 4.056 ns coincidence time window was used. Sinogram size > 336 x 336 x559 42
3.Image reconstruction Effect of TOF in image quality • Methods andmaterials • Signal to noise ratio (SNR ) • Defined as the difference between the lesion and background relative to the noise level in the background: • Contrast • The contrast can be used to measure the convergence of an iterative algorithm. • Noise • It is defined as the ratio between the standard deviation of the background and the background level. 43
3.Image reconstruction Effect of TOF in image quality • Acquisition method • Several list mode acquisitions were simulated with different number of counts covering typical high and low count cases counts rates (970 x 106, 112 x106, and 12 x 106 counts). • Drawing circular regions of interest (ROIs) on the spheres as well as on the background regions (manually defined). Signal in ROI Noise in ROI 44
3.Image reconstruction Effect of TOF in image quality • Reconstructed images • A central slice of the reconstructed volume of the IQ phantom containing the hot spheres. • Improvement in image quality can be observed for the smallest lesion (10 mm sphere) when images are reconstructed with TOF information. Non-TOF TOF 45
3.Image reconstruction Effect of TOF in image quality • High statistics (970 Mcts) 46
3.Image reconstruction Effect of TOF in image quality • High statistics (970 Mcts) 47
3.Image reconstruction Effect of TOF in image quality • Intermediate statistics (112 Mcts) • The SNR reached is lower than in the previous case, due to the lower number of counts. 48
3.Image reconstruction Effect of TOF in image quality • Intermediate statistics (112 Mcts) • The contrast-noise trade-off is better for TOF compared with non-TOF images. 49
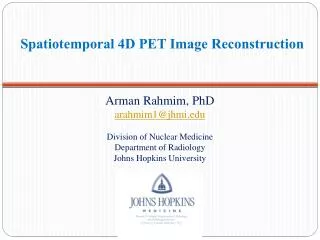
3.Image reconstruction Effect of TOF in image quality • low statistics (12 Mcts) • The SNR reached is lower than in the previous case, due to the smaller number of counts. 50