Download
1 / 11
110 likes | 111 Views
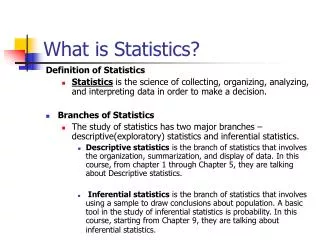
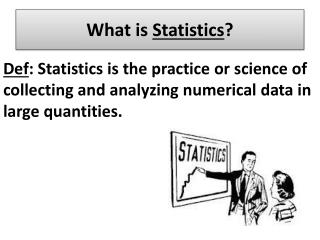
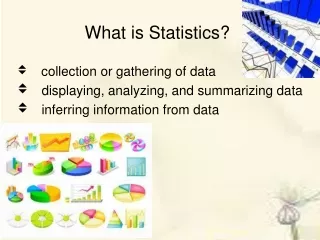
Learn the basics of statistics, including how to collect, organize, analyze, and interpret numerical information from data. Understand different types of variables and levels of measurement. Explore descriptive and inferential statistics methods.

E N D
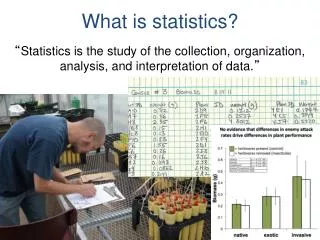
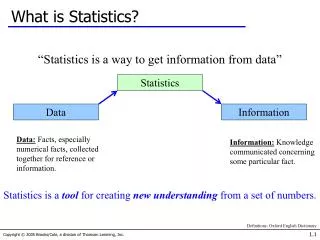
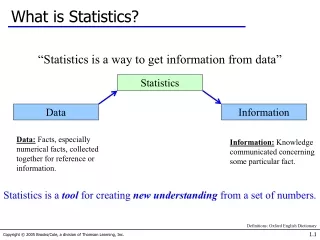
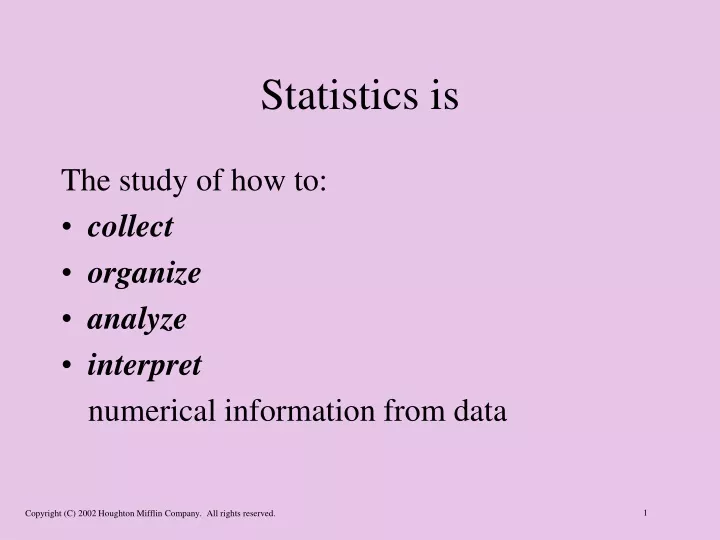
Statistics is The study of how to: • collect • organize • analyze • interpret numerical information from data
Individuals and Variables • Individual: a person or object included in a study • Variable: a characteristic of the individual to be measured or observed
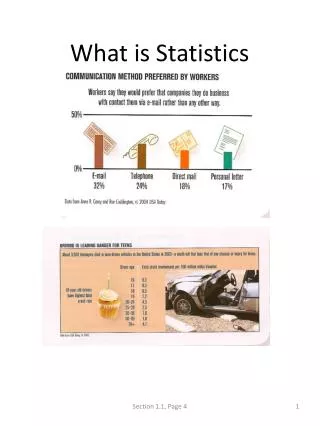
Quantitative and Qualitative Data • Quantitative variable has a value or numerical measurement • example: number of siblings • Qualitative variable places an individual in a category or group • example: brand of computer
Population Variable is taken from every individual of interest Example: incomes of all residents of a county
Sample Variable is taken from only some of the individuals Example: incomes of selected residents
Levels of Measurement • Nominal • Ordinal • Interval • Ratio
Nominal Measurement Data is put into categories only. Example: eye color
Ordinal Measurement Data can be ordered. Differences cannot be calculated or interpreted. Example: class rank
Interval Measurement Data can be ordered. Differences between data values can be compared. Example: temperature
Ratio Measurement Data can be ordered. Differences and ratios between data values can be compared. Example: time
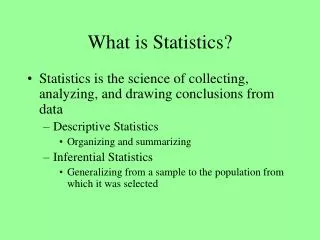
Branches of Statistics • Descriptive: methods of organizing, picturing, and summarizing information • Inferential: methods of using information from a sample to draw conclusions regarding the population