Download
1 / 27
270 likes | 274 Views
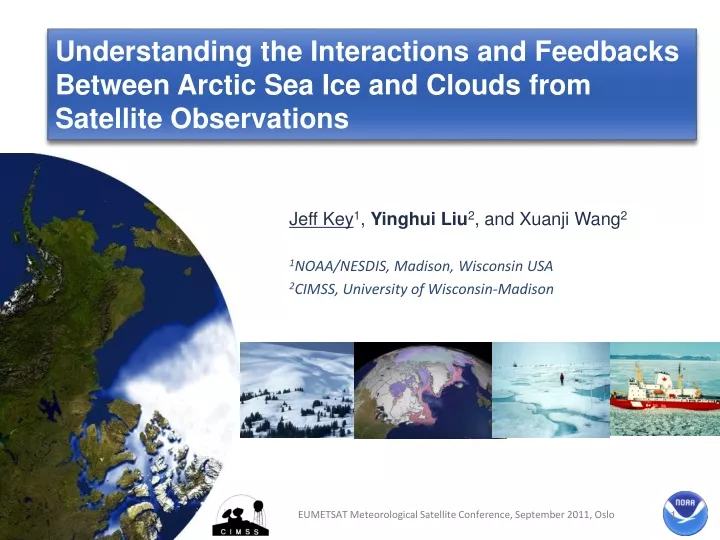
Understanding the Interactions and Feedbacks Between Arctic Sea Ice and Clouds from Satellite Observations. Jeff Key 1 , Yinghui Liu 2 , and Xuanji Wang 2 1 NOAA/NESDIS, Madison, Wisconsin USA 2 CIMSS, University of Wisconsin-Madison.

E N D
Understanding the Interactions and Feedbacks Between Arctic Sea Ice and Clouds from Satellite Observations Jeff Key1, Yinghui Liu2, and Xuanji Wang2 1NOAA/NESDIS, Madison, Wisconsin USA 2CIMSS, University of Wisconsin-Madison EUMETSAT Meteorological Satellite Conference, September 2011, Oslo
Arctic surface temperature has been changing Arctic-wide annual averaged surface air temperature anomalies (60°–90°N) based on land stations north of 60°N relative to the 1961–90 mean. (Overland et al., 2008) IABP/POLES (1979-97) Rigor et al. (2000)
Sea ice has been changing (Courtesy of NSIDC)
Arctic cloud cover has been changing Spring Winter Time series of seasonally averaged cloud from APP-x and TPP (left). Trends in cloud amount in spring (right, upper), and winter (right, bottom) from TPP,1980-1998 (Schweiger 2004).
The Arctic climate system is complex Wiring diagram for the atmospheric component of the Arctic hydrologic system. Blue (yellow) hubs are drivers (recipients), red (blue, black) arrows denote interactions of the same (opposite, competing) sign (Francis et al. 2009). What are the relationships between changes in Arctic surface temperature, sea ice, and cloud cover?
Data • Dataset • Extended AVHRR Polar Pathfinder (APP-x) • Cloud mask • Surface temperature under all-sky conditions • Other parameter, not used here: surface albedo, cloud properties, radiative fluxes, ice thickness • Sea ice Concentration from SMMR and SSM/I with NASA team algorithm • Sea ice concentration • Derived parameters • Seasonal means and trends of surface temperature under clear, cloudy, and all-sky conditions • Seasonal means and trends of cloud amount • Seasonal means of surface temperature over water and ice • Seasonal trends of sea ice concentration
APP-x: Trends in surface temperature and cloud cover Winter Winter Spring Spring Autumn Summer Autumn Summer APP-x all-sky surface temperature trends, 1982-2004 APP-x cloud cover trends, 1982- 2004 Surface temperatures from satellites show cooling trends in winter and warming trends in other seasons; decreasing clouds in winter, increasing in spring.
APP-x: Cloudy vs clear surface temperatures Spring Winter The difference between the seasonal mean surface temperature (K) under cloudy and cloud-free conditions. Summer Autumn Clouds warm the surface at all times of the year, except for a brief period in the summer (not shown).
Earlier work: Cloud forcing If cloud cover had not changed the way it did, Arctic surface temperatures would have risen even more than what was observed. This conclusion was based on trends in cloud forcing, which showed an increasing cooling trend. Time series of seasonally averaged cloud radiative effect (“forcing”) from APP-x. Top to bottom: Trends in cloud forcing in winter, spring, summer, fall, and the annual average, each for shortwave, longwave, and net cloud forcing. (Wang and Key, 2003; 2005)
Trend Partitioning Can we quantitatively determine the effect of trends in cloud cover and sea ice on the trend in surface temperature? Here is a mathematical formulation: Average surface temperature is a function of clear and cloudy temperatures and the area fractions of cloud and ice A: cloud effect B: sea ice effect C: residual trend The fine print: Changes in cloud cover are assumed to be independent of changes in sea ice. We’ll address that later. (Liu, Key, and Wang, 2008; 2009)
Results: Cloud effect on surface temperature trend Spring Winter Summer Autumn Surface temperature trends introduced by cloud amount changes (K/decade) In winter, the cloud cover trend explains -0.91 out of -1.2 K decade-1 of the cooling. In spring, it is 0.55 of the total 1.0 K decade-1 warming.
SSM/I: Water vs ice surface temperatures Winter Winter Spring Spring Summer Autumn Summer Autumn Difference of seasonal mean surface temperature over water and over ice under clear conditions (K). Seasonal mean sea ice concentration trends from 1982 to 2004.
Results: Sea ice effect on surface temperature trend Winter Spring Summer Autumn Surface temperature trends introduced by sea ice concentration changes (K/decade). In the Chukchi and Beaufort Seas in autumn, surface warming due to changes in sea ice accounts for 0.9 K decade-1 of the total 1.1 K decade-1 warming trend in that area.
Challenges and Opportunities What other parameters contribute to the residual trend? Are changes in cloud independent of changes in sea ice? Residual trends as the difference of the total trend and trends introduced by changes in cloud amount and sea ice concentration.
Are changes in cloud independent of changes in sea ice? Qualitatively, an increase in cloud amount tends to correspond to a decrease in SIC and ice extent. (a) Difference of Sept-Oct 2007 MODIS cloud amount and the 2002-07 Sept-Oct mean, (b) AMSR-E SIC anomalies for 2007 based on the 2002-07 mean.
Changes in cloud amount and SIC are related Instantaneous correlations between cloud amount and sea ice concentration anomalies
Sea ice and Cloud: Data and Methods • Datasets • MODIS (Moderate-resolution Imaging Spectroradiometer) Level-3 atmospheric daily global product, including daily mean cloud amounts for each 1 degree by 1 degree cell, 2000-2010. • Sea ice concentration (SIC) with spatial resolution of 25 km from the Special Sensor Microwave/Imager (SSM/I),1979-2010. • Methods • The Equilibrium Feedback Analysis (EFA) is used to assess the local “feedback” of sea ice concentration on cloud amount. The Monte Carlo method is used to calculate the confidence level. • Weekly mean and anomalies of MODIS cloud amount and SSM/I SIC are calculated, with seasonal cycle and trends removed. • Instantaneous and lead-lag correlations between weekly anomalies of MODIS cloud amount and SSM/I SIC are calculated.
Equilibrium Feedback Analysis (EFA) The response of cloud amount (rapid process, decorrelation time <2 weeks ) to the sea ice (slow process, decorrelation time > 2 months) is: Where C(t) is the cloud amount at time t, λcI(t) is the cloud response to a change in sea ice I(t) after time dta, λc is the feedback (or response) efficiency (or parameter) of sea ice on cloud; N(t+dta) is the climate noise independent of sea ice variability. The feedback parameter can be calculated as: where τ is the time lag, which is longer than the persistence time of cloud internal variability. EFA has been extensively used to assess the local feedback of SST on the overlying atmospheric fields, and the feedback of vegetation on climate (Frankignoul et al. 1998, Liu et al. 2006, 2008, and etc.).
Feedback Parameter of sea ice on the cloud amount Decrease of sea ice concentration leads to increase in cloud amount. (Only area with the confidence levels greater than 95%, using the Monte Carlo method, are shown)
Area averaged feedback of sea ice on cloud amount In areas 1, 2, and 5, a 1% decrease in SIC leads to 0.3-0.4% increase in cloud amount in different seasons.
Summary • Surface temperatures from satellite show cooling trends in winter and warming trends in spring; decreasing clouds in winter, increasing in spring. Clouds warm the surface throughout the year except for a brief period in summer. • Based on a decreasing warming effect and increasing cooling effect of clouds, it was inferred that if cloud cover had not changed the way it did, Arctic surface temperatures would have risen even more than what has been observed. • The trend partitioning scheme shows that • In winter, the cloud cover trend explains -0.91 out of -1.2 K decade-1 of the cooling. In spring, it is 0.55 of the total 1.0 K decade-1 warming. • In the western Arctic Ocean in autumn, warming due to changes in sea ice accounts for 0.9 K decade-1 of the total 1.1 K decade-1 warming. • The feedback (response) parameter showed that a 1% decrease in sea ice concentration corresponds to a 0.3-0.4% increase in cloud amount in Beaufort, Chuckchi, and Laptev Seas.
Conclusion Cloud cover influences surface temperature, sea ice concentration influences surface temperature, and sea ice influences clouds. We knew that before, but now we know how much.
References Liu, Y., J. Key, and X. Wang, 2009, Influence of changes in sea ice concentration and cloud cover on recent Arctic surface temperature trends, Geophys. Research Lett., 36, L20710, doi:10.1029/2009GL040708. Liu, Y., J. Key, and X. Wang, 2008, The influence of changes in cloud cover on recent surface temperature trends in the Arctic, J. Climate, 21, 705-715, DOI: 10.1175/2007JCLI1681.1. Liu, Y., J. Key, J. Francis, and X. Wang, 2007, Possible causes of decreasing cloud cover in the Arctic winter, 1982-2000, Geophys. Res. Letters, 34, L14705, doi:10.1029/2007GL030042. Wang, X. and J. Key, 2005, Arctic surface, cloud, and radiation properties based on the AVHRR Polar Pathfinder data set. Part II: Recent trends, J. Climate, 18(14), 2575-2593. Wang, X. and J. Key, 2003, Recent trends in Arctic surface, cloud, and radiation properties from space, Science, 299(5613), 1725-1728.
Arctic surface temperature has been changing AVHRR clear-sky (1981-2001) Comiso (2003) IABP/POLES (1979-97) Rigor et al. (2000)
Lead-lag Correlation of Cloud and SIC in Autumn Autumn: July to November Region 1: (lon: 120-180 lat: 75-85) Region 2: (lon: 45-90 lat: 75-85) Ice leads Cloud leads
Sea ice and Cloud: Discussion Changes in cloud may be associated with the changes in large-scale circulation. 15 -15 Cloud amount (%) difference between cyclonic and anticyclonic conditions in winter, spring, summer and autumn. Trends (1949-2002) in annual and seasonal total Arctic cyclone activity. (Sorteberg et al. 2008)