Download
1 / 1
20 likes | 316 Views
Phylogeography of Leucetta chagosensis (Porifera, Calcarea). Christoph Flucke, Jens Kurz, Rasmus Liedigk, Zdenka Valenzova. Fig.1: ITS region. 3. Results.

E N D
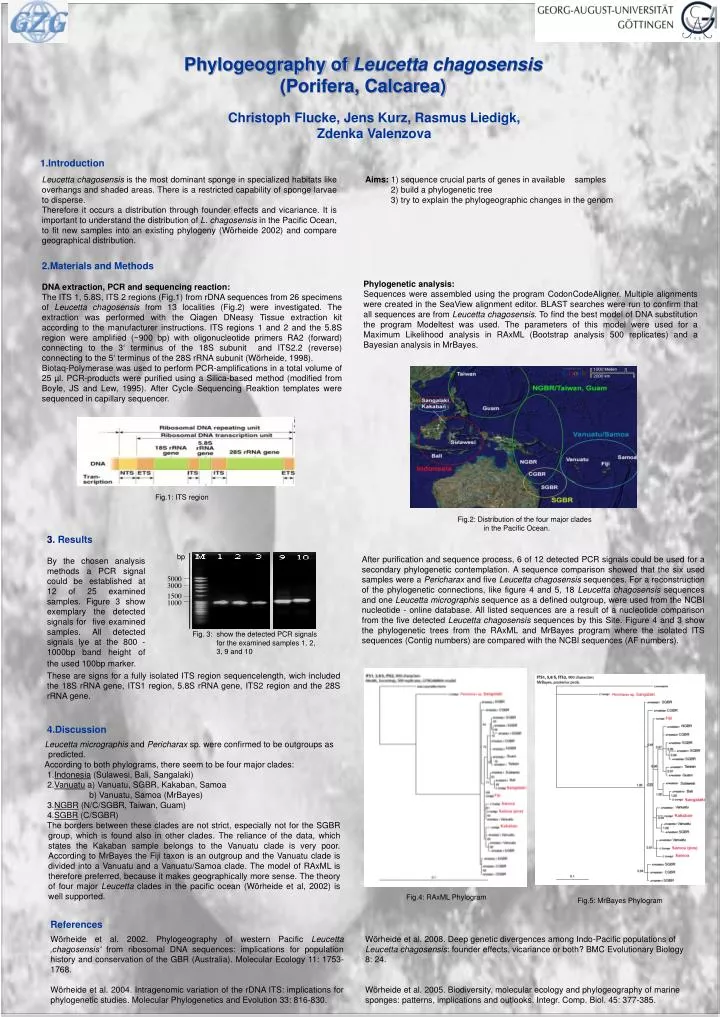
Phylogeography of Leucetta chagosensis(Porifera, Calcarea) Christoph Flucke, Jens Kurz, Rasmus Liedigk, Zdenka Valenzova Fig.1: ITS region 3. Results After purification and sequence process, 6 of 12 detected PCR signals could be used for a secondary phylogenetic contemplation. A sequence comparison showed that the six used samples were a Pericharax and five Leucetta chagosensis sequences. For a reconstruction of the phylogenetic connections, like figure 4 and 5, 18 Leucetta chagosensis sequences and one Leucetta micrographis sequence as a defined outgroup, were used from the NCBI nucleotide - online database. All listed sequences are a result of a nucleotide comparison from the five detected Leucetta chagosensis sequences by this Site. Figure 4 and 3 show the phylogenetic trees from the RAxML and MrBayes program where the isolated ITS sequences (Contig numbers) are compared with the NCBI sequences (AF numbers). By the chosen analysis methods a PCR signal could be established at 12 of 25 examined samples. Figure 3 show exemplary the detected signals for five examined samples. All detected signals lye at the 800 -1000bp band height of the used 100bp marker. bp 5000 3000 1500 1000 Fig. 3: show the detected PCR signals for the examined samples 1, 2, 3, 9 and 10 Fig.2: Distribution of the four major clades in the Pacific Ocean. 4.Discussion Leucetta micrographis and Pericharax sp. were confirmed to be outgroups as predicted. According to both phylograms, there seem to be four major clades: 1.Indonesia (Sulawesi, Bali, Sangalaki) 2.Vanuatu a) Vanuatu, SGBR, Kakaban, Samoa b) Vanuatu, Samoa (MrBayes) 3.NGBR (N/C/SGBR, Taiwan, Guam) 4.SGBR (C/SGBR) The borders between these clades are not strict, especially not for the SGBR group, which is found also in other clades. The reliance of the data, which states the Kakaban sample belongs to the Vanuatu clade is very poor. According to MrBayes the Fiji taxon is an outgroup and the Vanuatu clade is divided into a Vanuatu and a Vanuatu/Samoa clade. The model of RAxML is therefore preferred, because it makes geographically more sense. The theory of four major Leucetta clades in the pacific ocean (Wörheide et al, 2002) is well supported. Fig.4: RAxML Phylogram Fig.5: MrBayes Phylogram 1.Introduction Leucetta chagosensis is the most dominant sponge in specialized habitats like overhangs and shaded areas. There is a restricted capability of sponge larvae to disperse. Therefore it occurs a distribution through founder effectsand vicariance. It is important to understandthe distribution of L. chagosensis in the Pacific Ocean, to fit new samples into an existing phylogeny (Wörheide 2002) and compare geographical distribution. Aims:1) sequence crucial parts of genes in available samples 2) build a phylogenetic tree3) try to explain the phylogeographic changes in the genom 2.Materials and Methods DNA extraction, PCR and sequencing reaction: The ITS 1, 5.8S, ITS 2 regions (Fig.1) from rDNA sequences from 26 specimens of Leucetta chagosensis from 13 localities (Fig.2) were investigated. The extraction was performed with the Qiagen DNeasy Tissue extraction kit according to the manufacturer instructions. ITS regions 1 and 2 and the 5.8S region were amplified (~900 bp) with oligonucleotide primers RA2 (forward) connecting to the 3‘ terminus of the 18S subunit and ITS2.2 (reverse) connecting to the 5‘ terminus of the 28S rRNA subunit (Wörheide, 1998). Biotaq-Polymerase was used to perform PCR-amplifications in a total volume of 25 µl. PCR-products were purified using a Silica-based method (modified from Boyle, JS and Lew, 1995). After Cycle Sequencing Reaktion templates were sequenced in capillary sequencer. Phylogenetic analysis: Sequences were assembled using the program CodonCodeAligner. Multiple alignments were created in the SeaView alignment editor. BLAST searches were run to confirm that all sequences are from Leucetta chagosensis. To find the best model of DNA substitution the program Modeltest was used. The parameters of this model were used for a Maximum Likelihood analysis in RAxML (Bootstrap analysis 500 replicates) and a Bayesian analysis in MrBayes. These are signs for a fully isolated ITS region sequencelength, wich included the 18S rRNA gene, ITS1 region, 5.8S rRNA gene, ITS2 region and the 28S rRNA gene. References Wörheide et al. 2002. Phylogeography of western Pacific Leucetta ‚chagosensis‘ from ribosomal DNA sequences: implications for population history and conservation of the GBR (Australia). Molecular Ecology 11: 1753-1768. Wörheide et al. 2004. Intragenomic variation of the rDNA ITS: implications for phylogenetic studies. Molecular Phylogenetics and Evolution 33: 816-830. Wörheide et al. 2008. Deep genetic divergences among Indo-Pacific populations of Leucetta chagosensis: founder effects, vicariance or both? BMC Evolutionary Biology 8: 24. Wörheide et al. 2005. Biodiversity, molecular ecology and phylogeography of marine sponges: patterns, implications and outlooks. Integr. Comp. Biol. 45: 377-385.