Download

1 / 18
180 likes | 270 Views
Columbia River Benefits and Costs Jim Fredericks June 8, 2009 Northwestern Division. Columbia River Treaty Benefits.

E N D
Columbia River Benefits and Costs Jim FredericksJune 8, 2009Northwestern Division
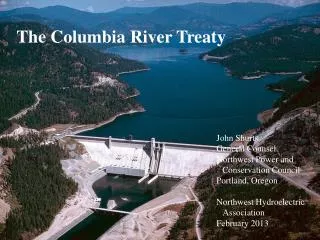
Columbia River TreatyBenefits “Being desirous of achieving the development of those resources in a manner that will make the largest contribution to the economic program of both countries and to the welfare of their peoples of which those resources are capable…”
Flooding Issues • 1948 Memorial Day Flood • 50 deaths; > $100 Million damages in US and Canada.
Storage Benefits Comparison of 50-year Average Monthly Unregulated Flow to a Regulated Flow for Power/Flood Control at The Dalles in Kcfs • Flood Damage Reduction • Hydropower Benefits • Increased Energy (aMW) • Increased Dependable Capacity (MW) • Other Benefits as well • Irrigation, M &I, Recreation, ect.. 500 Flood Control & Power Regulation 450 400 Unregulated 350 300 250 200 Avg.=182 kcfs 150 100 50 0 Aug Sep Oct Nov Dec Jan Feb Mar Apr May Jun Jul
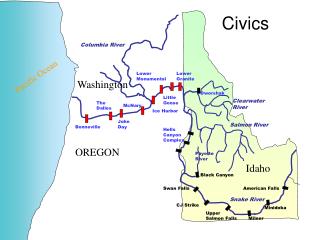
Projects Constructed • Mica – completed 1973 • Duncan completed 1973 • Arrow (Keenelyside) – completed 1968 • Libby completed 1973 (U.S.)
Duncan • 1.4 MAF (1.73 km3) • No hydropower • Fluctuates 30m
Mica • 5.0 MAF (6.14 km3) Non-Treaty Storage • 7.0 MAF (8.63 km3) • 1740 MW Capacity • One of the largest earth fill dams in the World.
Arrow (Kennleyside) • 7.1 MAF (8.76 km3) • 185 MW Capacity • Navigation lock
US Project - Libby • 5.0 MAF (6.14 km3) • 604 MW Capacity • Construction Cost $585M (1981$) • Benefit to cost ratio for power 3.4 to 1. • Benefit to cost ratio for flood damage reduction 1.3 to 1.
What the U.S. Paid • For Flood Control- $64.5 MillionThis amount was based on one-half of the estimated present worth value of flood damages prevented over a period of sixty years. • Hydropower – Canada was entitled to one-half the downstream benefits. Estimated at 1,200 to 1,500 MW of capacity and 520 to 560 average megawatts of energy. Canada subsequently sold this to the US for 30 years for $254.4 Million.
Other Costs of Upstream Storage • Fish and Wildlife Mitigation • hatcheries, spill, and other actions • Lost cultural resources • inundation of historical and sacred sites • Social impacts • Dislocation of residents
Economic Benefits and Costsof the Columbia and its Tributaries • Benefits – Hydropower, flood damage reduction, irrigation, water supply, navigation, and recreation.
Columbia River Basin Benefits and Costs • Hydropower Projects • 75% of Corps National installed capacity (15,600 MW) • 52% of Northwest hydropower output • Flood Damage Reduction • System Development Cost $5B • Cumulative flood damages prevented $14B • Damages prevented as a result of reservoirs $6B • Navigation • 992 miles of navigable waterways • 10 Locks
Federal Objective • The Federal objective of water and related land resources planning is to contribute to national economic development consistent with protecting the Nation’s environment statutes, applicable executive orders, and other Federal planning requirements.
Evaluation Criteria – 4 Accounts • National Economic Development (NED) • Changes in the economic value of the national output of goods and services. • Regional Economic Development (RED) • Changes in the distribution of regional economic activity. • Environmental Quality (EQ) • Non-monetary effects on significant natural and cultural resources. • Other Social Effects (OSE) • Not reflected in other three accounts.
NED Account has been the focus • NED Benefits • Hydropower • Costs of the most likely alternative • Other thermal (Coal, Combustion-Turbine, Combined cycle combustion turbine) • Flood Damage Reduction • Actual or simulated market price • Damages with and without the storage
BPA Fish & Wildlife Expenditures • $8.6B expenditures through 2006 • $2.9B power purchases • $1.78B foregone revenues • $1.71B for Council’s direct program • $1.38 B for dam fish passage • $862.2M for mitigation costs associated with Federal projects.