Download
1 / 28
290 likes | 403 Views
Mid Continent Intensive Campaign. Kenneth Davis 1 and Stephen M. Ogle 2 Co-Coordinators of MCI Campaign Task Force 1 Penn State University 2 Natural Resource Ecology Laboratory, Colorado State University. NOAA Aircraft (~weekly). NOAA Tall Tower (planned for summer 2007).

E N D
Mid Continent Intensive Campaign Kenneth Davis1 and Stephen M. Ogle2 Co-Coordinators of MCI Campaign Task Force 1 Penn State University 2Natural Resource Ecology Laboratory, Colorado State University
NOAA Aircraft (~weekly) NOAA Tall Tower (planned for summer 2007) NOAA Network Flask (weekly) NOAA Tall Tower (planned post-summer 2007) Calibrated Continuous Surface/Short tower site: PSU, Indiana University, LBNL,UofNE PSU Ring of Towers location (5 sites TBD) NOAA Radon Analyzer NACP MCI: NOAA + OTHER CALIBRATED CO2 SURFACE/SHORT TOWER SITES
Overarching Goal Compare and reconcile to the extent possible, regional carbon flux estimates from “top-down” inverse modeling with the “bottom-up” inventories CO2, CO, CH4 CO2 CH4 CH4CO2 CO2 CH4 CO2 CH4 C C
Primary Objectives • Develop approaches to estimate fluxes using “top-down” atmospheric budgets and “bottom-up” inventories • Individual studies • Provide both “top-down” and “bottom-up” flux estimates and associated uncertainties • MCI data products • Evaluate results with independent validation data for both approaches • Additional measurements • Evaluate differences in results between “top-down” and “bottom-up” approaches, diagnose problems, and improve estimates • Synthesis activity
Secondary Objectives • Provide the basis for optimization of field, satellite and atmospheric sampling schemes • Determine mechanisms driving regional net fluxes patterns in the MCI region • Assemble data products required for the “bottom-up” and “top-down” approaches • Provide guidance to future intensives
Science Team • Voluntary Membership • Investigators with funded projects have been solicited to register relevant studies at NACP website • Currently includes 34 funded studies and 145 investigators • Topic groups have been established to focus on specific objectives
Organization of Science Team Primary Investigations Topic Group 2: Top-Down Inverse Modeling Topic Group 1: Subregional Intensives Consensus Products Topic Group 3: Bottom-Up Modeling Topic Group 4: Subregional to Region Analysis Topic Group 5: Regional Top-Down to Bottom-Up Analysis Comparative Analyses
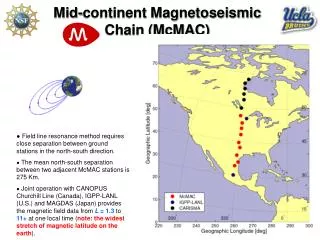
Region-wide “top-down” flux estimates (topic 2) • multiple independent approaches • atmospheric inventory MSP NE WI IL IA OK • Region-wide “bottom-up” flux estimates (topic 3) • multiple independent approaches • ecological inventory • Syntheses: (Topic 4,5) • - between whole region and sub-regional intensives • between top-down and bottom-up methods (Obj 1, 2) (Obj 1, 2, 3) • Sub-domain intensives/clusters (flux) (Topic 1) • develop and evaluate bottom-up and top-down methods at fine spatial scales (Obj 1, 2, 3) Primary Objectives Flux estimates Internal method evaluation Cross-method evaluation (Obj 1, 2)
Griffis, Baker, McFadden - corn/soy, suburban Bolstad, Davis, Kolka, Heinsch, Saliendra, Denning, Curtis - ChEAS - Forest Verma - Mead - corn/soy Williamson, Meyers, Bernacchi, Anderson - Bondville - Corn/soy MSP NE Stephens - CME - mountains. MCI neighbor WI/MI IL IA OK Torn, Berry, Fischer - ARM - wheat, pasture. MCI neighbor Sub regional intensives - topic 1 Parkin - corn/soy Other contributions
Sub-regional intensives: typical characteristics • Clusters of flux towers encompassing multiple stand types • Inventory and other more spatially extensive ground sampling to complement / aid in extrapolating flux tower data • Airborne remote sensing (multispectral, lidar) and Quickbird remote sensing to provide custom, high-resolution land surface products. • Ecological model development using the intensive data • Sub-regional flux estimates using multiple upscaling methods • Independent sub-regional flux estimates for evaluation (tall tower or aircraft eddy covariance, sub-regional scale atmospheric inversions)
Region-wide “bottom-up” flux estimates • - multiple independent approaches Whole-region bottom-up projectstopic 3 Challenge - take advantage of the plethora of “topic 1” data and knowledge..
Region-wide “top-down” flux estimates (topic 2) • - multiple independent approaches Whole-region top-down projects - topic 2 Many atmospheric inversions have region-wide terrestrial carbon flux priors
Mead, NE Intensive StudyPI: S. Verma; Funding: DOE Irrigated and Rainfed Maize-Based Agroecosystems Measurements of Mass and Energy Fluxes Mead, Nebraska Close Up of Eddy Covariance Flux Sensors Eddy Covariance Measurements of Carbon Dioxide and Other Fluxes Measuring Components of Solar Radiation UNIVERSITY OF NEBRASKA
Land use within a 10 km radius of the Tall Tower facility based on 30 m resolution USGS NLCD. The major land classes include 40% row crop (brown, mostly corn and soybean) and 33% pasture lands (yellow). Carbon Cycle Processes within a Managed Landscape in Minnesota PI: T. Griffis; Funding: NSF EC-TDL isotope system at the University of Minnesota Rosemount Experiment Station. This system will be deployed at the tall tower facility in spring 2007 Tall Tower at RROC (240 m)
Carbon Stock Change in Agricultural Lands PI: S. Ogle; Funding: USDA, NASA Model Inputs Assess Uncertainties: Soil Monitoring Network Remote Sensing: MODIS EVI PDF Ecosystem Simulation Model Plant Growth CO2 Multi-Scale Estimates: Site, Regional and National Scales Land Use and Management Activity Residues CO2 CO2 CO2 CO2 Active SOM Slow SOM Passive SOM CO2 CO2 Environmental Conditions: Soils and Weather
Soil C Stock Change in Croplands for Mid-Continent Region (PI: T. West; Funding: NASA) Cumulative change from 1991-2000 = 67.7 Tg C. Estimates of soil carbon change at 30x30m resolution using combination of remote sensing and inventory products (West et al. in preparation).
Improved Fossil/Industrial CO2 Modelling PI: K. Gurney; Funding: NASA All Fossil Sources Ln tonnes C/day/gridcell
NOAA ESRL Tall Tower & Aircraft North American Network PIs: A. Andrews and P. Tans; Funding: NOAA Tower Aircraft Continuous Observations: CO2, CO, horizontal wind, T, RH 3 levels: 30, 100, 500m PAR, Rainfall, Surface Pressure Flask Samples: Weekly aircraft profiles-2005 (right now most sites are every 3 weeks) Species: CO2, CO, CH4, N2O, SF6, isotopes, Halocarbons, COS, limited 14CO2 GPS, temperature, pressure Flask Samples: Daily mid-afternoon from top level (+5 extra per week) Weekly aircraft profiles Species: CO2, CO, CH4, N2O, SF6, isotopes Halocarbons, COS, … 14CO2($$) Continuous Observations on some flights: CO2, O3
Framework for the Harvard/Arizona models PI: S. Wofsy; Funding: NASA “measured” land surface DCO2, DCO and DCH4 DATA: CO2, CH4, CO (conc'ns)—tall tower and aircraft CO2, CO, CH4 bdry values:remote sta., aircraft data modeled land emission DCO, DCO2, DCH4 combustion and advected CO2, CO, CH4 Optimize, a, b Fossil fuel, fire inventories Influence (Footprints) High resolution meteorological fields STILT surface flux Model Optimal regional fluxes +funct'l response Remote Sensing and Driver Data (EVI, sunlight, temperature, soil moisture, vegetation height) a priori Eddy flux and field data Top-Down Model INPUTS PRODUCT
Data Management, PI: B. Cook; Funding: NASA NACP User Community (and others) Digital Elevation ModelSRTM Soils – CONUS+ Land Cover – MODIS • MAST-DC • Web Page • Link to Thematic • Centers • Index of MAST-DC • Data (Mercury) • OPeNDAP access to • MAST-DC Data Metadata Registry Historical Land UseLEDAPS • Services • Data Access • Subsetting • WMS/WCS Weather / Climate -DAYMET LAI / fPAR MODIS4NACP Nitrogen – Dentener Observation Data Packages to evaluate model results Bottom-up Model Output Atmos. Measurements Coastal Ocean Investigator Data Remote Sensing Regional Intensives Flux Tower Networks Extensive Inventories Top-Down Model Output Other Thematic Data Centers
Progress, concerns • Progress - making the whole more than the sum of its parts • MCI investigators’ community is tangible - Feb 2006 meeting in Boulder, this meeting. Define specific goals for future meetings. • NACP support group - metadata of projects - excellent resource. • MAST-DC, ORNL-DAAC. • Concerns • Slow tall tower build out. Still only one site for MCI. • Several MCI flux towers unsupported for 2007. • Synthesis topics (4, 5) need attention, possibly additional support (e.g. must compare top-down - data not yet collected - to bottom-up - many projects nearing completion).
Shameless promotion of an upcoming (relevant) event Attention: Graduate students involved in research on regional-scale terrestrial biogeochemical cycles of carbon, water and nitrogen: Apply for the National Center for Atmospheric Research's (NCAR), 2007 Advanced Study Program's Summer Colloquium, "Regional Biogeochemistry: Needs and Methodologies" to be held June 4-15, 2007 in Boulder , CO. Desai et al. NCAR-ASP and ChEAS RCN (NSF). http://www.asp.ucar.edu/colloquium/2007/index.jsp • Application deadline is March 1, 2007 For questions regarding the colloquium email: asp-coll1@asp.ucar.edu