Download
1 / 64
640 likes | 642 Views
Learn how to time your stock selling decisions using technical analysis and key indicators. Understand market conditions, signs of weakness, and the importance of cutting losses early. Explore case studies and profit-loss plans for successful selling.

E N D
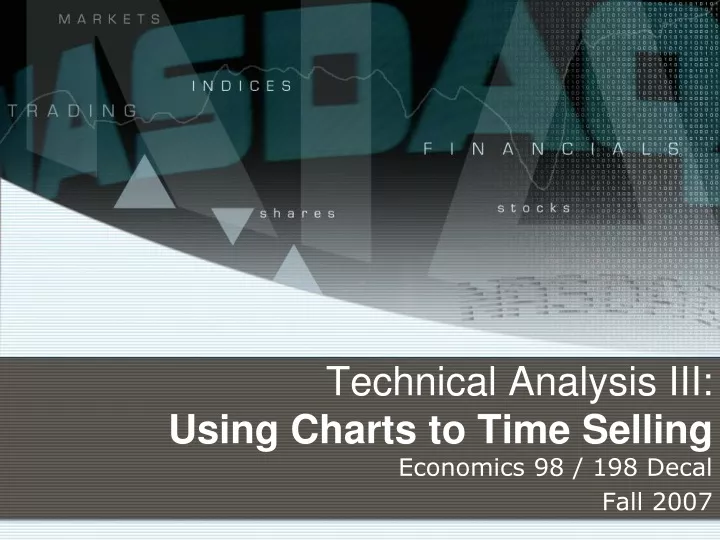
Technical Analysis III:Using Charts to Time Selling Economics 98 / 198 Decal Fall 2007
Using Charts to Time Selling Current Events / Stock Discussion
Using Charts to Time Selling Lecture Content
Summary of last lecture • Technical Analysis • Using stock charts to time market bottoms • Rally, follow-through, counting days • Using stock charts to time buy points • Stock formations / bases • Cup with handle / double bottom / flat base • Strong characteristics of bases • Additional buy point: 50 Day moving average
S&P 500 (Early 2007 Follow-through) Prior Downtrend Follow-through Day 5 (+1.75% on on high volume) Rally Attempt Day 1 Failed Rally Attempt Day 1
ROLL – Pullback to 50 DMA Pullback Bounces off 50DMA on above average volume
SPAR – Ascending Triangle SPAR SPAR Volume perks up on breakout
Today’s lecture • General principles for selling stocks whether for a loss or for a profit • Key Selling Indicators • Market direction • Cutting losses short • Individual stock chart analysis • Signs of weakness (churning, breaking support, resistance) • climax tops • changes of trend
Why knowing when to sell is so important Nasdaq (2000) Let’s say you bought an index fund or ETF here @ 3,500
Why knowing when to sell is so important Nasdaq (2000) Within a year and a half, you would have lost your profits plus more!
Why knowing when to sell is so important Yahoo! (1997 – 2006) Peak of $120 96% loss here Bottom of $4.50 To recover from bottom, YHOO would have to increase 2600%
Sell Decisions Sell decisions should be based largely on technical analysis Don’t wait for fundamentals to deteriorate Market Conditions Climax Tops Signs of Weakness Change of trend
#1 Selling Rule: Cutting losses early • Set yourself a maximum sell rule • How much you set depends on your risk tolerance (5 – 10% a good #) • Why do it? • Use stop-loss orders if you don’t have time or control with emotions
#1 Selling Rule: Cut Losses Early Source: “How to Sell Stocks to Limit Losses.” IBD Online | Learning Center
Why cutting your losses is important • Chicago Board of Trade (CBOT) • Great fundamentals (strong earnings, sales growth, ROE, etc.) • Cup with handle base • Strong accumulation in base • Break out on strong volume Buy here @ $128
Why cutting your losses is important I might be wrong and I should be cutting my losses here at @ $119 • Chicago Board of Trade (CBOT) • Action of the stock doesn’t go according to plan and eventually, reverses to below breakout point • What do you do here? • Cut your losses early • Sell when 7% (or less) below buy point
Why cutting your losses is important • Chicago Board of Trade (BOT) Bought here @ $128 Now I don’t know what to do with a 34% loss!!!! #$!@#$!
Using Charts to Time Selling Market Analysis:Timing TOPs / Downtrends
Market Direction: Downtrends / Tops • Always preceded by signs of weakness (heavy selling) in major market indexes • Distribution Day (4 or 5 within 4 weeks) raises red flags • Other market weakness signs • Days when market starts strong, but ends very weak (low on the intra-day) • Leading stocks start to deteriorate
Let’s look at the NASDAQ 2000 Bubble as it happenedMany distribution days within short time: more selling than buying. Furthermore, many leaders were peaking as well. Clearly, institutions were getting rid of shares.It went from good to bad to ugly Market Direction: Downtrends / Tops
2000 Market Top 4/5 distribution days can tip a market over, so 7 within 4 weeks screams out that the market is heading for the gutters
2000 Bubble: Leaders Breaking Down The 2000 bubble went down in history as having the most climax tops at a market top (we’ll discuss this later). Essentially, this means GET OUT!!!!!
Market Direction: Downtrends / Tops 2000 Bubble 2004 Market Downtrend Yahoo Inc. DOWN 88% in 12 months CSCO. DOWN 38% in 8 months Qualcomm Inc. DOWN 88% in 31 months Leading stocks of current market uptrend usually fall the hardest when market tops occur
Using Charts to Time Selling Profit-loss plan
Profit & Loss Plan • Most stocks after bases move up 20-25%, build bases / patterns, and then in some cases, resume advances • If all goes according to plan, take your profit at this 20-25% gain point the exception to this is…
Exception… • If stock rises 20% in 1-4 weeks on heavy volume, then hold on for at least another 8 eight weeks • Why do this? Quick, strong advance shows unusual strength in the stock. Potential to be a great winner. • After that, re-evaluate to see if stock should be held for longer term
“Bulls make money and bears make money, • but pigs get slaughtered.” Using Charts to Time Selling Individual Stock Chart Analysis: Selling
General Signs of Weakness • Downward Reversals • Stock begins to move up, only for a sudden change downwards in price • Even worse, when volume is HIGH • Distribution • Stock closes at a lower price than prior day/week on above-average volume • In general words, big selling
Change of Trend • Long-term uptrend line is broken on overwhelming volume • Greatest one-day price drop • 200-day moving average line turns down • Living below 10-week moving average
Example 1 50DMA Violation The stock cuts the 50 DMA on heavy volume. It’s not getting support at this level Rallies back on light volume Source: “How to Sell Stocks to Maximize Your Profits: Moving Averages” IBD Online | Learning Center
Example 1 50DMA Violation The stock cuts the 50 DMA on heavy volume. It’s not getting support at this level Rallies back on light volume Source: “How to Sell Stocks to Maximize Your Profits: Moving Averages” IBD Online | Learning Center
Example 2 Stock cuts 50DMA on heavy volume and struggles to rally above that line. 50 DMA becomes level of resistance
Example 2 Stock cuts 50DMA on heavy volume and struggles to rally above that line. 50 DMA becomes level of resistance
Example 3 The stock had already a big move up. If a stock closes with its largest one day gain in the entire move, watch out. This usually occurs at the peak. Largest one day drop (-3.50) If a stock has its largest one day drop, then consider selling if confirmed by other signals (distribution, reversals, climax activity)
Big reversal Example 3 The stock had already a big move up. If a stock closes with its largest one day gain in the entire move, watch out. This usually occurs at the peak. Gap-down Largest one day drop (-3.50) If a stock has its largest one day drop, then consider selling if confirmed by other signals (distribution, reversals, climax activity)
Example 4Weekly Trendline Broken If you connect lows of weekly closes, can identify a major trend line here Consider selling if confirmed by other signals when stock breaks major trend line on overwhelming volume NOTE: Don’t draw too many lines. Trend lines drawn on too short of time periods aren’t valid
Example 4Weekly Trendline Broken If you connect lows of weekly closes, can identify a major trend line here Consider selling if confirmed by other signals when stock breaks major trend line on overwhelming volume NOTE: Don’t draw too many lines. Trend lines drawn on too short of time periods aren’t valid
Climax Tops • Explosive price / volume action of leading stocks and/or industries • Indicate trouble ahead for the stock • Occurs at end of the stock’s run • Traits • Exhaustion Gaps • Excessive Stock Splits • Huge price spreads with reversals • Extended +100% over 200-day moving average • Huge price-run up at end of movement (25% - 50% in 3 weeks or less)
Example 1 Climax top shows abnormal activity after stock’s previous run-up. Notice the BIG reversal at the peak on extremely high volume. Can you see the difference in price movement behavior? NOTE: Climax tops occur at end of a stock’s run. Increasing price movements at beginning of a stock’s move is positive. Source: “How to Sell Stocks to Maximize Your Profits: Climax Tops” IBD Online | Learning Center
HUGE REVERSAL on explosive volume (ended on the bottom of the intraday spread) Source: “How to Sell Stocks to Maximize Your Profits: Climax Tops” IBD Online | Learning Center
Example 2 Notice the explosiveness of the price movements at the end of the stock’s move. 60% gain in 8 days. Exhaustion gap to finish the climax top off
Example 3 Telecom stocks enjoyed huge up-trend ride during late 1990’s Climax action by leading stocks gave sell signals for the industry and the market in general Notice the explosive action by the leading stocks Source: “Topping Action By Industry’s Leaders Flashes Sell Signal.” Investors Business Daily Online
Other Signs of Weakness (secondary indicators) • Heavy volume without further upside price progress (churning, sign of distribution) • Accumulation days with larger distribution days • New highs on low volume • Big buyers lost appetite for rise • Signs of poor rally (decline on big volume, and then rally on low volume)
Notice how the stock reaches new highs and the advance is on very tame volume. This is a sign of weakness and raises a red flag.
Rally on light volume Notice a sharp decline from the first peak And then, a rally on very light volume