Download
1 / 8
80 likes | 323 Views
TOTAL QUALITY MANAGEMENT. TOOLS OF TQM (2) Abdulla Jassim Abdulla. The Seven Tools oF TQM. Flowcharts Cause and effect Diagram (Ishikawa) Check sheets Pareto Charts Histograms Run Charts and Control charts Scatterplots and correlation Analysis. Pareto Charts.

E N D
TOTAL QUALITY MANAGEMENT TOOLS OF TQM (2) Abdulla Jassim Abdulla
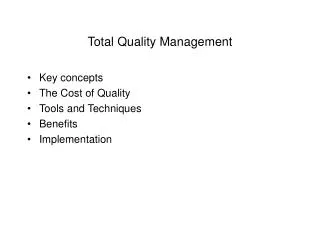
The Seven Tools oF TQM • Flowcharts • Cause and effect Diagram (Ishikawa) • Check sheets • Pareto Charts • Histograms • Run Charts and Control charts • Scatterplots and correlation Analysis
Pareto Charts • Named after Wilfredo Pareto. • Prioritize problems • Categorical Data
Histograms • Process Variability • Continuous Data • Factors important when investigating Histograms: • Variations • Location • Shape • Unusual features
Bar charts • Graphical summary of data • Display group differences • Ordinal data
Unusual Features in Histograms • Bimodal histograms • Cut-off Distribution • Combed Distribution
Summary Statistics • Mean • Median • Standard Deviations • Variance
Run Charts • Variation (Trends) over time. • Data Could be Means, counts or proportions collected over time.