Download
1 / 34
390 likes | 574 Views
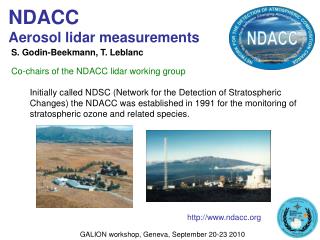
An Interagency Research Initiative for Ground-Based Lidar Profiling of Tropospheric Ozone and Aerosol CENRS Air Quality Research Subcommittee Nov. 17, 2011 Washington, DC.

E N D
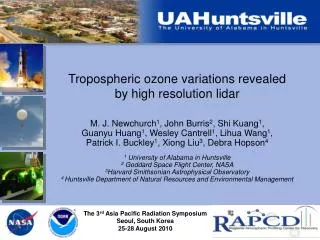
An Interagency Research Initiative for Ground-Based Lidar Profiling of Tropospheric Ozone and Aerosol CENRS Air Quality Research Subcommittee Nov. 17, 2011 Washington, DC Mike Newchurch1, Jay Al-Saadi2, R. J. Alvarez3, John Burris4, John Hair5, Russell DeYoung5, Mike Hardesty3, Shi Kuang1, A. O. Langford3, Stuart McDermid6,Tom McGee4, Christoph Senff3, Jim Szykman7 1UAHuntsville 2NASA/HQ 3NOAA/ESRL 4NASA/GSFC 5NASA/LaRC6NASA/JPL 7USEPA DRAFT
I. Motivation for prototype ozone lidar network measurements PBL Processes, especially those involving the diurnal pumping of the boundary layer, are the scientific key to understanding regional/local interactions resulting in surface ozone. Understanding the spatio-temporal complexity of these physical and chemical processes demands observations at high spatial (initially vertical) and temporal resolution. Ozonesondes are extensively used in various atmospheric chemistry studies because of their low upfront cost and well-characterized behavior. However, the whole process for a sonde launch typically requires four hours. And four-hour ozonesonde resolution is prohibitively expensive. We therefore consider lidars to provide the necessary spatial and temporal resolution. GEO-CAPE will measure tropospheric gases and aerosols at ~8km and hourly resolution. Vertical resolution is on the order of 5-10kmin the troposphere. This vertical resolution is inadequate to resolve laminar structures that characterize tropospheric ozone and aerosols. Furthermore, GEO-CAPE information content in the PBL will likely be inadequate to resolve the processes responsible for air quality variability. We seek, therefore, to understand how the spaceborne measurements may be complemented with a ground-based measurement system. Air quality models are critical for supporting important policy decisions. Unfortunately, the general lack of high-resolution observations aloft limits the evaluation of air-quality models. The lidarprofiling measurements can make significant contributions in evaluating air-quality models and improving their simulation and forecasting capabilities. DRAFT
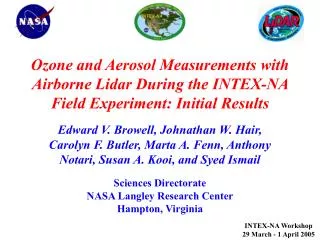
Comparison of the techniques for ozone observation a For OMI tropospheric ozone retrieval [Liu et al. 2010], [Worden et al. 2007]. b For ground-based only. The airborne lidar system can measure ozone with a 600-m spatial resolution, e.g., [Langford et al. 2011]. c For ground-base system, e.g., Sunnesson et al.1994; Proffitt and Langford 1997; Kuang et al. 2011. The temporal resolution is strongly related to the retrieval uncertainty. Generally longer integration time will reduce the uncertainty arising from statistical error. d The estimated cost is based on $800/launch and launching 6 sondes every day. DRAFT
Lidar ozone curtain with10-minute resolution ozonesonde DRAFT
Partners • NASA R&A initiated and invited participation in AQLNWG • Name the members here? • Funding • NASA providing funding to adapt existing instruments, begin acquiring data, archive data, and facilitate data use • NOAA and EPA providing funding for instrument conversion, deployment, data analysis • Agency roles • NASA: Historical funding of several lidar programs and GEO-CAPE satellite program. • NOAA: Funding of ESRL lidar group, AQ campaigns, NESDIS satellite programs. • EPA: Principal user and policy driver. DRAFT
Purpose of the AQLNWG Provide high-resolution time-height measurements of ozone and aerosols at a few sites from near surface to upper troposphere for scientific investigations of air-quality processes and GEO-CAPE mission definition. Develop recommendations for lowering the cost and improving the robustness of such systems to better enable their possible use in future national networks to address the needs of NASA, NOAA, EPA and State/local AQ agencies. DRAFT
Charge to the AQLNWG • Is a lidar network for air-quality measurements a high priority for advancing the state of the science? How would a NASA demonstration activity fit into monitoring needs/plans for other agencies and the nation? Can it fulfill needs for satellite retrieval algorithm development and cal/val? • Instrument hardware: Is a commercial solution available or imminent? What specific technology development may be required, and what mechanism is appropriate (e.g., NASA Centers, SBIR)? How soon could candidate instruments be available? Do we know these things, or should an RFI be issued? • What are the desired performance characteristics for: concentration, extinction, altitude range, sensitivity, measurement frequency, etc.? • What are the desired network characteristics: How many instruments would be needed for adequate demonstration? Where should they be located? Should portability be an emphasis? Consider value added by co-location within other networks (GALION, AERONET, MPLNET, profilers, AQ monitoring, supersites). • Synergies with other activities (field campaigns, e.g., Discover-AQ; routine aircraft profiling (MOZAIC/ IAGOS)). Assessment/improvement of CMAQ modeling. Integrated network system design strategy. Roles of different agencies/organizations. DRAFT
Science Investigations that the AQLNWG will address • Provide high spatio-temporal observations of PBL and FT ozone and aerosol for use by the GEO-CAPE science team to study the character of the atmospheric structure that GEO-CAPE will observe and assess the fidelity with which a geo instrument can measure that structure. • Discover new structures and processes at the PBL/FT boundary, especially in the diurnal variation of that interface. • Foster use of these high-resolution ozone and aerosol observations to improve the processes in air-quality forecast and diagnostic models. • Exploit synergy with DISCOVER AQ, thermodynamic profilers, MOZAIC/IAGOS, regulatory surface monitors, and other networks. • Improve our understanding of the relationship between ozone and aerosols aloft and surface ozone and PM values. [Fairlie et al., 2009] [Thompson, et al., 2008] [Morris, et al., 2010]. • Advance our understanding of processes controlling regional background atmospheric composition (including STE and long range transport) and their effect on surface air quality to prepare for the GEO-CAPE era. DRAFT
Instruments and Locations • Technology considerations and Brassboard instruments: 4 lidar technology approaches (YAG pumped Raman cells, YAG pumped Ce:LiCAF tunable laser, YAG pumped dye laser, OPO. • Location. Begin with current expertise at their locations. Also develop mobile lidars. • Undertake minimal instrument configuration changes to allow focus on making ozone measurements from near surface to middle or upper troposphere at several different locations across the USA that span the variability space. • TMF: 2-color Raman-cell system downwind of Los Angeles. Reduce lower altitude to ~few hundred meters AGL. • ESRL: Boulder, CO, Convert a/c TOPAZ lidar to ground-based scanning mobile instrument. • UAH: Huntsville, AL, Implement 3-color Raman-cell lidar and reduce lower altitude to ~200m AGL. • LaRC: Bring SESI Ce:LiCAF lidar to operation in a mobile configuration. • GSFC: Construct a 2-color Raman-cell lidar instead of OPO. DRAFT
III. Scientific investigations addressed by the lidar network DRAFT
Evolution of the Boundary Layer Ozone Maximum -lidar measurements and RAQMS model simulation (modeled by B. Pierce/U. of Wisconsin-Madison) May 5 May 4 May 3, 2010 EPA surface Daytime PBL top collapsed May 01 May 02 May 03 May 04 May 05 May 06 May 07 May 08 Missed May 6 (high PBL O3) May 7 DRAFT
O3 Transport: Nocturnal O3 enhancement associated with low-level jet Co-located wind profiler Kuang et al. Atmospheric Environment 2011 Low-level jet Higher increasing rate of the surface O3 due to the low-level transport on the previous day Lidar Oct. 4, 2008 Oct. 1, 08 Oct. 2, 08 Oct. 4, 08 Oct. 3, 08 Positive correlation of ozone and aerosol due to transport Co-located ceilometer backscatter Aerosol Oct. 6, 08 Oct. 5, 08 Surface O3 and convective boundary layer height DRAFT
Stratosphere-to-troposphere transport and its CMAQ Model simulation, Nov. 5, 2010 Modeled by ArastooPour-Biazar/UAH GOME total O3 Nov. 5 Huntsville Lidar O3 Stratospheric O3, zero RH Sonde Ozonesonde showing the high O3 and dry layer DRAFT Local time
High-resolution PBL lidar observation suggests both UV and Vis radiances required to capture significant PBL signal for satellite Huntsville lidar observation on Aug. 4, 2010 Lidar obs. convolved with OMI UV averaging kernel---- unable to capture the highly variable ozone structure in PBL Lidar obs. Convolved with OMI UV-Vis averaging kernel----Captures the PBL ozone structure. X. Liu et al. DRAFT
Stratospheric contribution to high surface ozone in Colorado during springtime A.O. Langford, K.C. Aikin1, C.S. Eubank1, E.J Williams1 Chemical Sciences Division ESRL, NOAA, Boulder, Colorado USA 1also at Cooperative Institute for Research in Environmental Sciences, University of Colorado, Boulder, Colorado, USA. Tropospheric Stratospheric DRAFT Langford NOAA/ESRL/CSD
E.J. Williams Surface O3 and CO anticorrelated DRAFT Langford NOAA/ESRL/CSD
CDPHE and NPS monitors Surface O3 increased from 55 to 100 ppbv in RMNP! DRAFT Langford NOAA/ESRL/CSD
JPL/TMF ozone & water vapor lidars O3 H2O Ozone (left) and water vapor (Right) with 10 minute resolution showing the progression of a stratospheric intrusion and the anti-correlation between ozone and water. DRAFT S. McDermid
Initial sites of the ground-based lidar network to provide O3 and aerosol data for air-quality study and GEO-CAPE mission Ancillary site info: TMF: sondes, ESRL: weekly sondes UAH: weekly sondes, miniMPL, physical profilers (T, U, ceilometer). LaRC: need CAPABLE input GSFC: need input NOAA/ESRL NASA/GSFC NASA/LaRC JPL/TMF UAH DRAFT 22
UAHuntsville planned configuration3 receiver channels covering 0.1-12km • 3- λ ( 283-289-299) system to minimize aerosol interference • Adding a 1-inch mini receiver channel to reduce the lowest measurement altitude to ~100m from the current 500m • Expected operation by summer 2012 Schematic diagram of the future transmitters and receivers. DRAFT
TOPAZ: NOAA’s airborne Ozone/Aerosol Lidar(TOPAZ = Tunable Optical Profiler for Aerosols and oZone) • Compact, light-weight, all solid state lidar • 3 tunable UV wavelengths • Designed for nadir-looking deployment on NOAA Twin Otter • Measures ozone and aerosol backscatter profiles • Altitude coverage: from near the surface up to 5 km MSL • Resolution (O3): 90 m vertical, 600 m horizontal • Precision (O3) : 2-15 ppb DRAFT
TOPAZ modifications for ground-based, scanning operation • Invert telescope to zenith-looking • Install in truck with roof top scanner DRAFT
Scan strategy & expected performance of ground-based TOPAZ ~4 km AGL 3-angle scan sequence designed to provide composite O3 profiles from 17 m to approx. 4 km AGL. Horizontal stares will be performed occasionally. 90º 10º 2º 17 m AGL • Anticipated instrument performance • Time resolution: 1 min per angle; 5 min per scan sequence • Range/altitude resolution: 90 m; 3 – 90 m • Range/altitude coverage: 400 m – 4 km; 17 m – 4 km AGL • Precision: 1 – 10 ppb (SNR and range dependent) DRAFT
Deployments of ground-based TOPAZ in FY 2012 • Uintah Basin Ozone Study (UBOS) • The UBOS study is designed to examine in detail the role of local atmospheric chemistry and meteorology in producing high wintertime O3 concentrations in the Uintah Basin in NE Utah. • TOPAZ will provide horizontal and vertical profiles of ozone as well as estimates of boundary layer height. • Time frame: February/March 2012 • 2. Local measurements (Boulder, Fritz Peak) • TOPAZ will measure vertical profiles of ozone at regular intervals at NOAA/ESRL in Boulder or at the Fritz Peak Observatory to a) provide a vertical context for the routine surface O3 observations in the greater Denver area and b) extend the record of mid-tropospheric ozone profile measurements by Langford et al. from the 1990s. • Time frame: April – September 2012 DRAFT
Comparison of the target configurations of the O3 lidars at different sites DRAFT
Conclusions • Ozone/aerosol lidar research initiative will address compelling science questions of regional/local processes controlling air quality • Laminar structures associated with long range pollutant transport and stratospheric influence • Residual O3 aloft and diurnal PBL pumping • These measurements will be used to • Measure the impact of ozone aloft on surface ozone over a diverse range of air-quality environments in the US • Evaluate air quality models to improve their simulation and forecasting capabilities • Provide high time-resolved observations to begin preparing for GEO-CAPE satellite mission observations expected early in the next decade • Inform future discussion about whether such measurements are needed routinely • Leveraging significant current instrumentation and expertise provides a cost effective way to obtain these research observations • Interagency interest and participation, and engagement of non-Federal partners to address high-priority research gaps, enhances the probability of effective outcome DRAFT
Backup DRAFT
LaRC ozone lidar Telescope Lidar Control DAQ System Receiver Box Laser Transmitter 1. Ground-based, but can be modified to a mobile system 2. Tunable two wavelengths within 282-313 nm for O3 measurement 3. 527nm for aerosol measurement DRAFT
GSFC tropospheric ozone lidar Schematic of the Non-Linear Optics bench within the laser. The Nd-YAG laser is mounted upside down on the underside of the NLO bench. The 1064 nm pump beam enters the NLO bench at the lower right. DRAFT
TOPAZ applications TexAQS 2006: Quantifying horizontal transport of O3 downwind from Houston and Dallas Cross sections of ozone downwind of Houston measured with TOPAZ on 08/14/2006. Ozone fluxes are computed for each transect by integrating above-background ozone across the plume and multiplying with horizontal wind speed measured with radar wind profilers. Ozone fluxes as a function of plume age downwind from Houston and Dallas (includes data from TexAQS 2000). Senff, C. J. et al., 2010: Airborne lidar measurements of ozone flux downwind of Houston and Dallas, J. Geophys. Res., 115, D20307, doi:10.1029/2009JD013689. DRAFT
TOPAZ applications Pre-CalNex 2009: Orographic lifting & long-range transport of O3 originating in the Los Angeles Basin 48-h (solid) and 60-h (dotted) forward trajectories suggesting long-range transport aloft of O3 from Los Angeles to Utah and Colorado. Langford, A. O., et al., 2010: Long-range transport of ozone from the Los Angeles Basin: A case study, Geophys. Res. Lett., doi:10.1029/2010GL042507. SMOG model predictions (top) compared with TOPAZ lidar observations (bottom). DRAFT