Download
1 / 19
220 likes | 391 Views
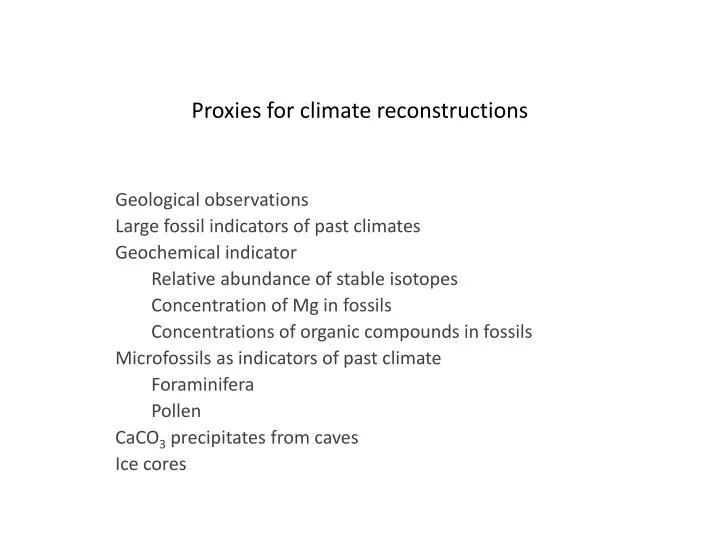
Proxies for climate reconstructions. Geological observations Large fossil indicators of past climates Geochemical indicator Relative abundance of stable isotopes Concentration of Mg in fossils Concentrations of organic compounds in fossils Microfossils as indicators of past climate

E N D
Proxies for climate reconstructions Geological observations Large fossil indicators of past climates Geochemical indicator Relative abundance of stable isotopes Concentration of Mg in fossils Concentrations of organic compounds in fossils Microfossils as indicators of past climate Foraminifera Pollen CaCO3 precipitates from caves Ice cores
Geomorphic indicators of past climates: Moraines (rock pile at maximum extent of glacier) Younger Dryas Waiho Loop Moraine, New Zealand Alaskan Moraine 19th century expedition
Geomorphic indicators of past climates: stream deposits Proglacial stream, New Zealand Proglacial braided streams, Alaska Outwash clasts, Iceland
Diamictite– rock fragments of all different sizes, with up to 25% of the mass > 2mm in size.Diamictites are often glacial debris but may also form from stream deposits
Geomorphic indicators of past climates: Dropstones in Neoproterozoic sediments Note coin for scale Note person for scale
Geomorphic indicators of past climates: Loess and paleosols Loess (depositional) and paleosols (darker layers signifying weathering and organic depostion during wetter period) Loess (windblown dust deposit, signifying aridity)
Fossil indicators of past climates • Vegetation • Plants have obvious preferences for mean annual temperature, mean annual precip, and seasonality of both properties • Pollen important for recent times • Plants adapt to environmental change (higher CO2 = fewer stomates) • Animals have temperature requirements • Particularly cold blooded animals • Plant and animal microfossils in the oceans have temperature preferences and tolerances
Isotopes that are indicators of past climates • Hydrogen • 1H, 2H (0.02%); 2H is also known as “deuterium” • dD (or d2H) = [(D/H)sample / (D/H)ref -1] x 1000 • Oxygen • 16O, 17O (0.04 %), 18O (0.20 %) • d18O = [(18O/16O)sample / (18O/16OH)ref -1] x 1000 • Carbon • 12C, 13C (1.1 %) • dC= [(13C/12C)sample / (13C/12C) ref -1] x1000
Nature of isotope effects • Physical isotope effects • Evaporation and precipitation (d18Ogas = d18Owater - 7 ‰) • Diffusion (gases of light isotopes diffuse faster than gases of heavy isotopes) • Chemical equilibrium isotope effects • Example: fractionation of O isotopes between H2O and CO32- • H216O + C16O218O2- = H218O + C16O32- • K = [H218O] [C16O32-] / [H216O] [C16O218O2-] • K is a function of temperature • Chemical kinetic isotope effects • Example: CO2 assimilation during photosynthesis • 12CO2 + H2O --> 12CH2O + O2 • 13CO2 + H2O -->13CH2O + O2 • k(13CO2) / k (12CO2) ~ 0.980 for C3 photosynthesis (trees, flowering plants, some grasses
Paleotemperatures using d18O of CaCO3 • K = [H218O] [C16O32-] / [H216O] [C16O218O2-] = function of temperature • Paleotemperature equation: • T(˚C) = 16.9 - 4.38*(dcalcite - dwater) + 0.10*(dcalcite - dwater)2 At 16.9˚, dT/dd ~ - 4.38; dd/dT ~ - 0.23 ‰ /˚C. • Standards: • Water: SMOW (Standard Mean Ocean Water) • Calcite: PDB-1 (Pee Dee formation Belemnite -1) • Complication: One needs to know dwater. • Modern ocean: dwater varies with salinity by ~ 1 ‰ (evaporation increases dwater) • Pleistocene ocean: dwatervaries with ice volume (~ 1 ‰ higher during glacial maximum) • Pre-Cenozoic ocean: dwateris not known; may been ~ 0.5 ‰ less than today • Freshwater environments: very hard to know dwater • Hydrologic fractionations: • Discrimination against 18O during evaporation • Discrimination favoring 18O during precipitation • Problem: diagenesis • CaCO3recrystalizes: CaCO3 + H2O --> Ca2+ + 2HCO3- --> CaCO3 + H2O • d18Ocalcite depends on recrystalization temperature and d18O of pore-space waters • For forams, recrystalization becomes important after 10’s of millions of years
Mg/Ca in forams and paleotemperatures • Basic evidence for temperature dependence: one experiment • Collect sinking forams in sediment traps to get temperature range • Measure temperature of the water • Measure Mg/Ca and compare with growth temperature • Derive curves of Mg/Ca vs. temperature for each species Mg/Ca + xe0.090T Cross section of a foraminifera shell
Paleotemperatures from the uk’37 index of alkenone undersaturation • Alkenones are hydrocarbon compounds with long chains of carbon atoms (37 in this case) • Most of the carbon atoms are linked by single bonds (they are saturated, each bonding with enough H atoms to fill up the valence state) • Some of the C atoms are linked by double bonds (undersaturated) • Coccolithofoidsproduce these alkenones (coccolithoforids are phytoplankton that make CaCO3 shells) • The position of double bonds changes as a function of temperature to regulate the viscosity of the cell fluid • In chemical notation, numbers indicate the position of double bonds
Uk’37 in surface seawater samples vs. collection temperature • For core top samples there is a compact relationship between Uk’37 and temperature • Trends are similar for all oceans • Sensitivity is poor above 25˚C and below 6˚C Conte et al 2006
Faunal reconstructions of past temperatures: an example based on the modern analog technique • All foraminifera have temperature preferences and tolerances • The species composition of a fossil foram assemblage depends on temperature • The reconstructed temperature will be most accurate if we look at the abundance of all the forams species in the sample) • The temperature dependence of modern assemblages is the reference • The temperature of a fossil assemblage is the temperature of the most similar modern assemblage
Illustration of temperature dependences of forams: menardii likes warmer waters than pachyderma Pachyderma abundance vs. water temp. Menardii + tumida abundance vs. water temp.
Climate reconstructions from pollen • Most pollen records come from lake sediments • Also some records from nearshore ocean sediment cores • Fossil species assemblages record the presence or absence of fossils in past times • Pollen abundance depends on • Proximity of biomes (trees that are abundant near the lake are overrepresented) • Production • Atmospheric transport • Removal processes (precipitation, dry fallout) Gajewski,2008
Modern pollen database serves to calibrate fossil assemblage paleotemperatures
CO2 Temperature, CH4, and CO2 records from the Vostok ice core Isotopic temp of ice CH4 Foram 18O 18O of CaCO3 (‰) (colder, more ice) 0 ka 200 ka 400 ka 600 ka 800 ka