Download
1 / 1
10 likes | 14 Views
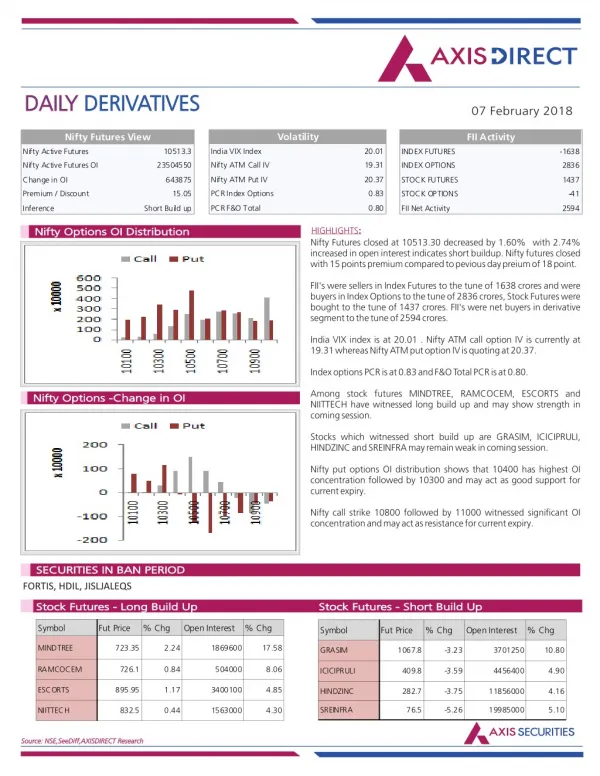
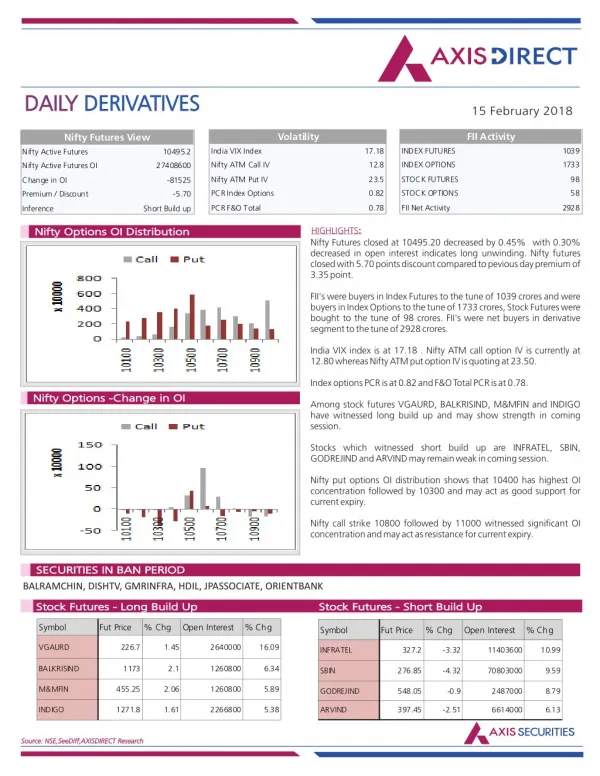
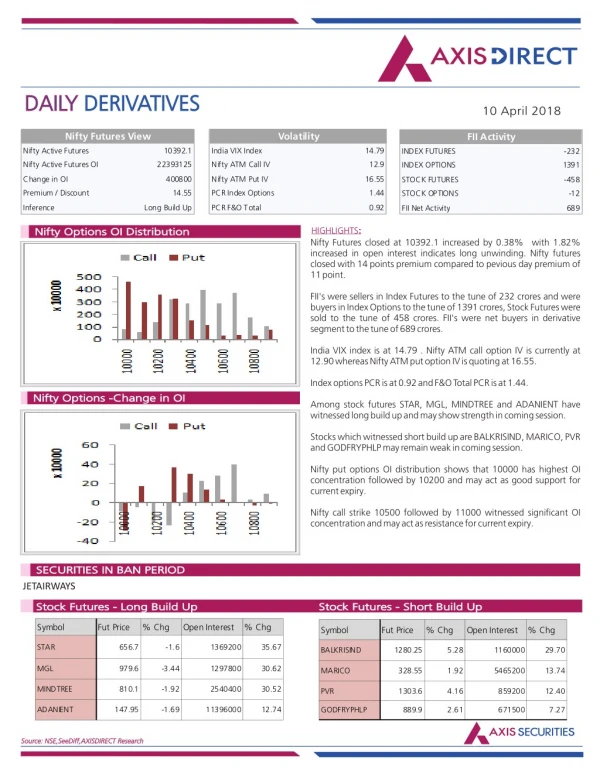
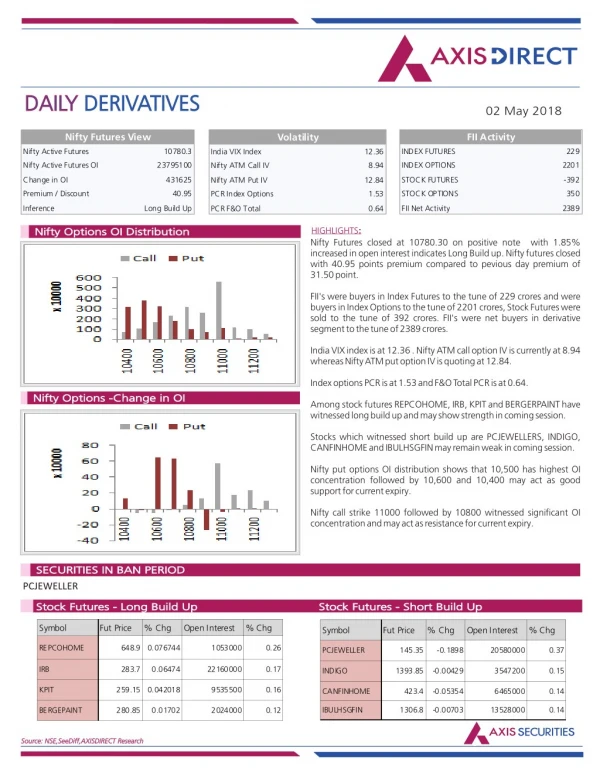
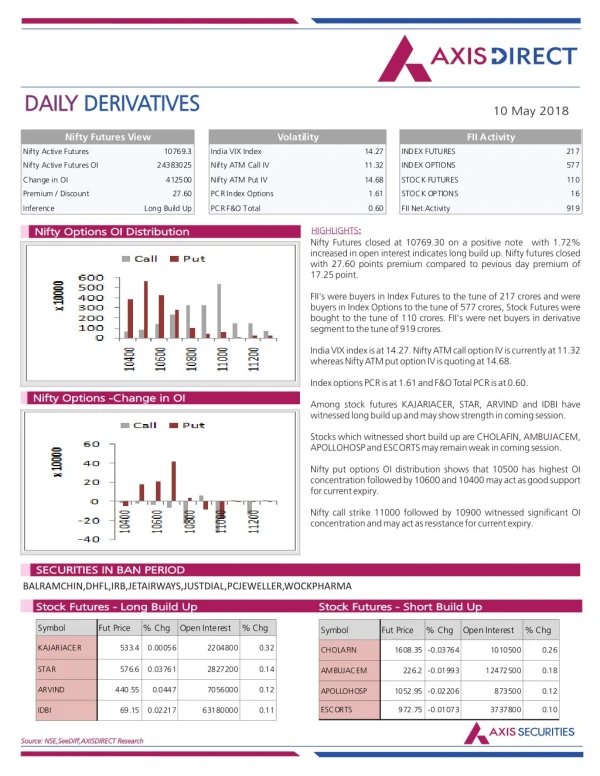
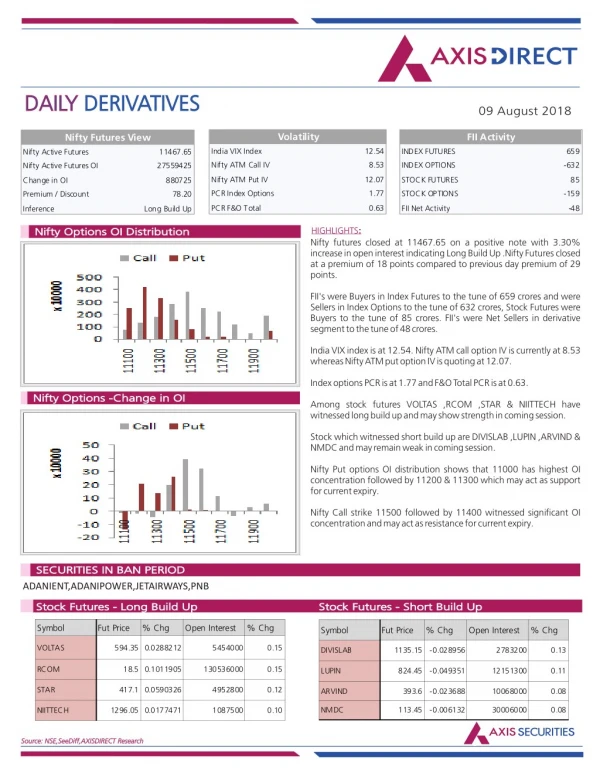
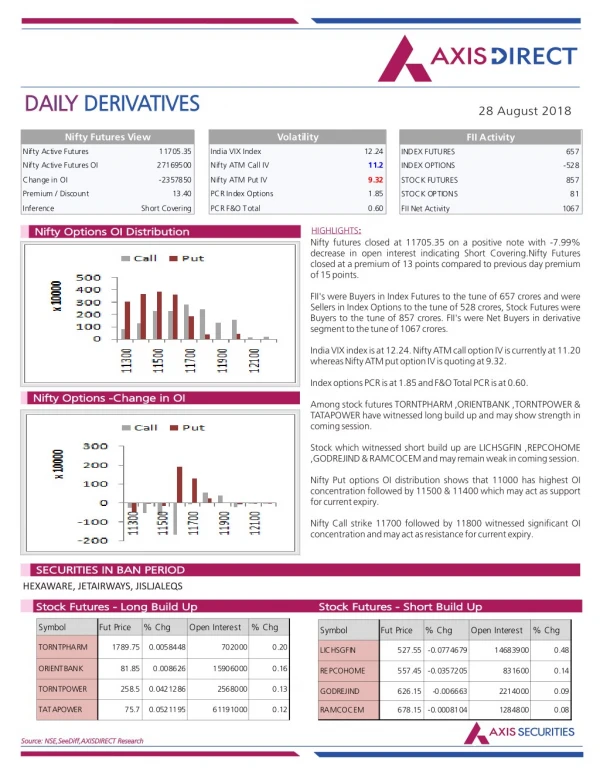
Axis Direct presents daily derivatives report presenting recommendations based on technical analysis. For trading in derivatives visit https://simplehai.axisdirect.in/offerings/products/derivatives<br>https://simplehai.axisdirect.in/share-stock-prices/nse/Adani-Ports-&-Special-Economic-Zone-Ltd-21281<br>https://simplehai.axisdirect.in/share-stock-prices/nse/Housing-Development-Finance-Corporation-Ltd-230<br>

E N D
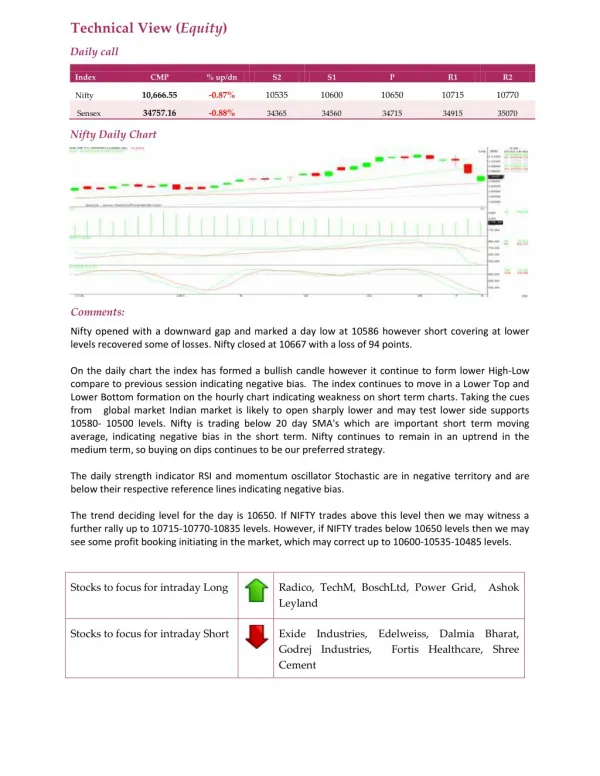
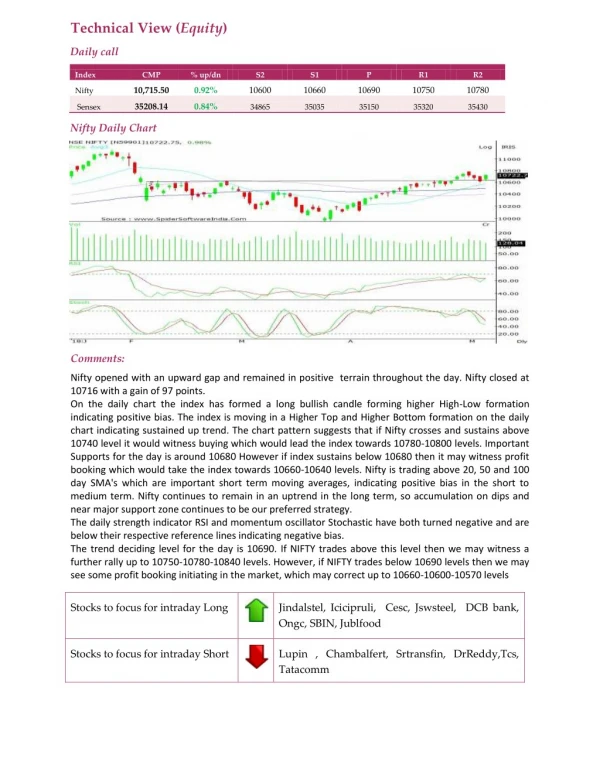
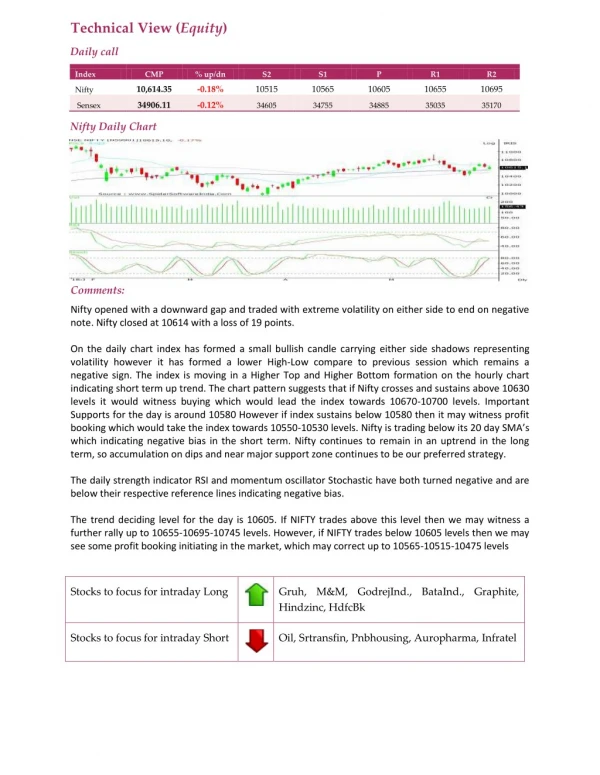
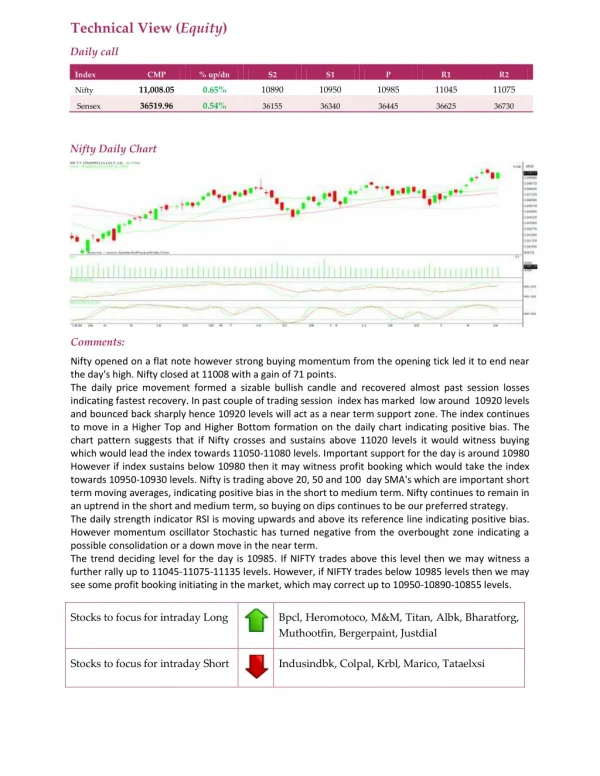
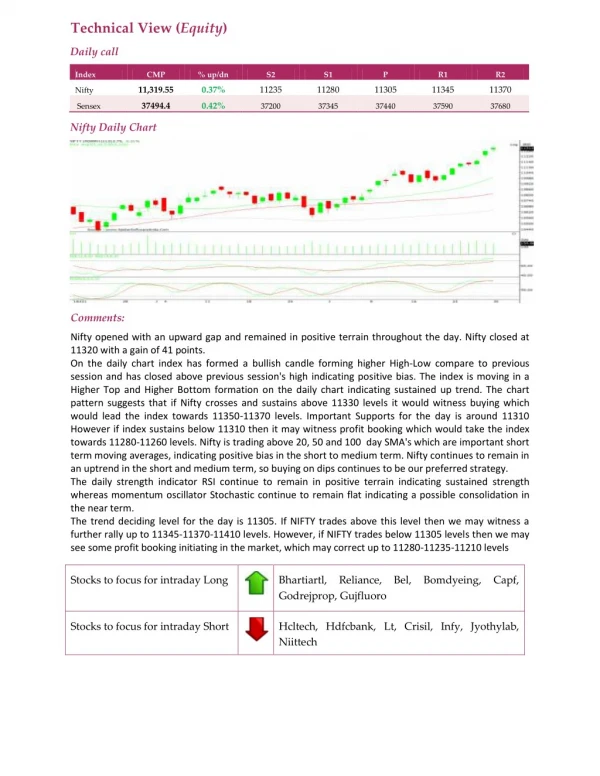
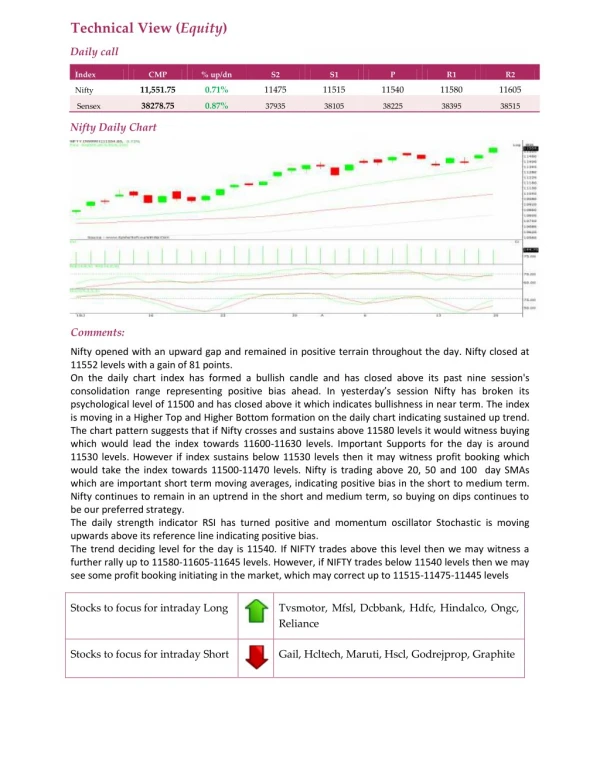
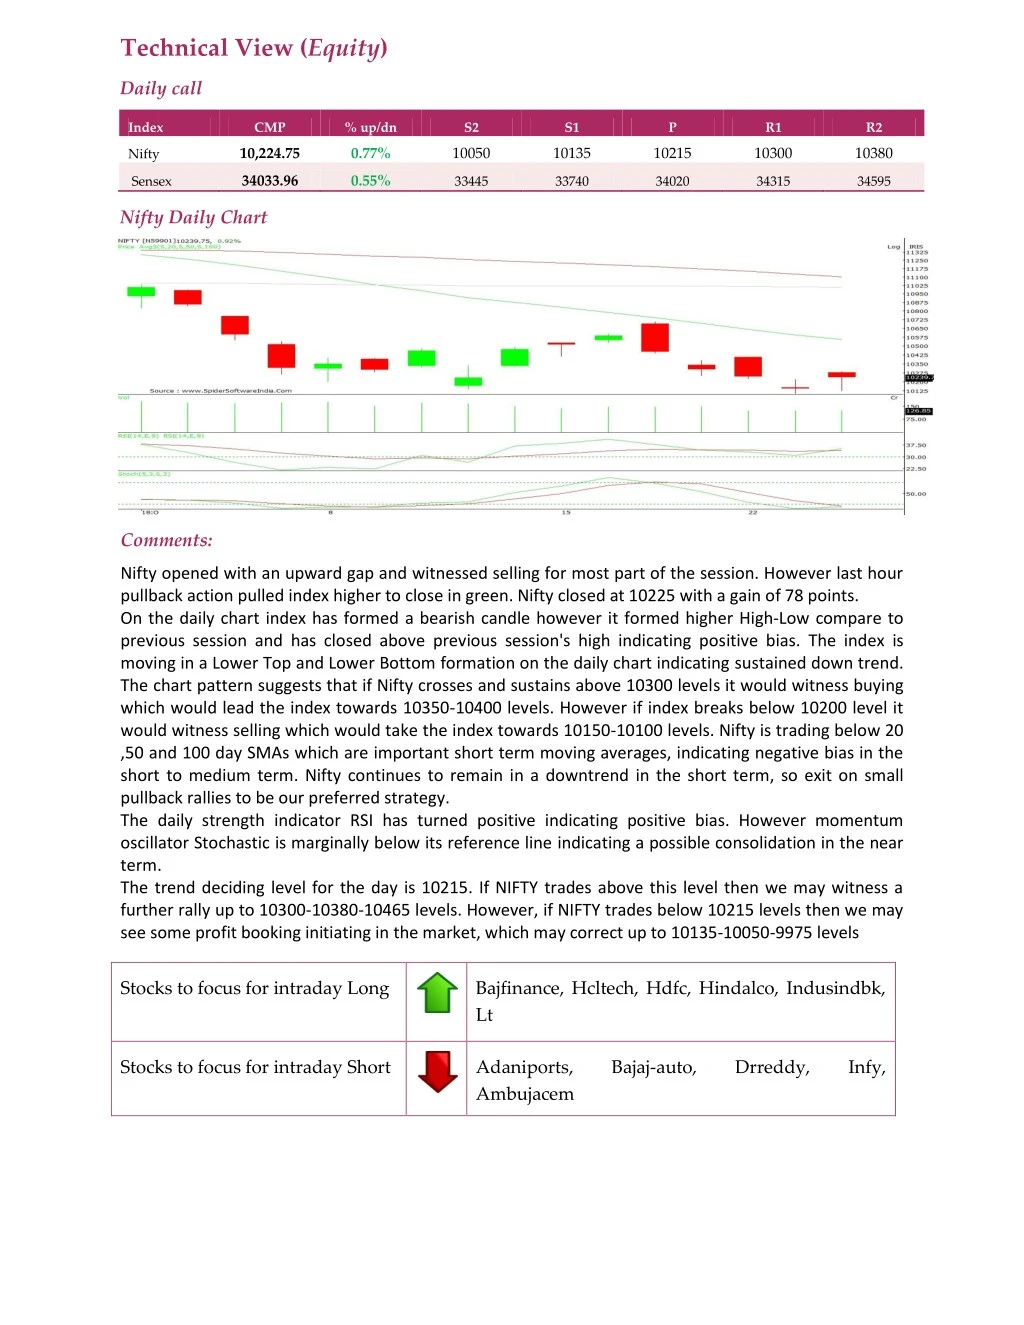
Technical View (Equity) Daily call Index CMP % up/dn S2 S1 P R1 R2 10,224.75 0.77% 10050 10135 10215 10300 10380 Nifty 34033.96 0.55% Sensex 33445 33740 34020 34315 34595 Nifty Daily Chart Comments: Nifty opened with an upward gap and witnessed selling for most part of the session. However last hour pullback action pulled index higher to close in green. Nifty closed at 10225 with a gain of 78 points. On the daily chart index has formed a bearish candle however it formed higher High-Low compare to previous session and has closed above previous session's high indicating positive bias. The index is moving in a Lower Top and Lower Bottom formation on the daily chart indicating sustained down trend. The chart pattern suggests that if Nifty crosses and sustains above 10300 levels it would witness buying which would lead the index towards 10350-10400 levels. However if index breaks below 10200 level it would witness selling which would take the index towards 10150-10100 levels. Nifty is trading below 20 ,50 and 100 day SMAs which are important short term moving averages, indicating negative bias in the short to medium term. Nifty continues to remain in a downtrend in the short term, so exit on small pullback rallies to be our preferred strategy. The daily strength indicator RSI has turned positive indicating positive bias. However momentum oscillator Stochastic is marginally below its reference line indicating a possible consolidation in the near term. The trend deciding level for the day is 10215. If NIFTY trades above this level then we may witness a further rally up to 10300-10380-10465 levels. However, if NIFTY trades below 10215 levels then we may see some profit booking initiating in the market, which may correct up to 10135-10050-9975 levels Stocks to focus for intraday Long Bajfinance, Hcltech, Hdfc, Hindalco, Indusindbk, Lt Stocks to focus for intraday Short Adaniports, Ambujacem Bajaj-auto, Drreddy, Infy,