Download
1 / 1
10 likes | 29 Views
Axis Direct presents daily derivatives report presenting recommendations based on technical analysis. For trading in derivatives visit https://simplehai.axisdirect.in/offerings/products/derivatives<br>https://simplehai.axisdirect.in/share-stock-prices/nse/Oil-&-Natural-Gas-Corpn-Ltd-6068<br>https://simplehai.axisdirect.in/share-stock-prices/nse/Lupin-Ltd-3026<br>

E N D
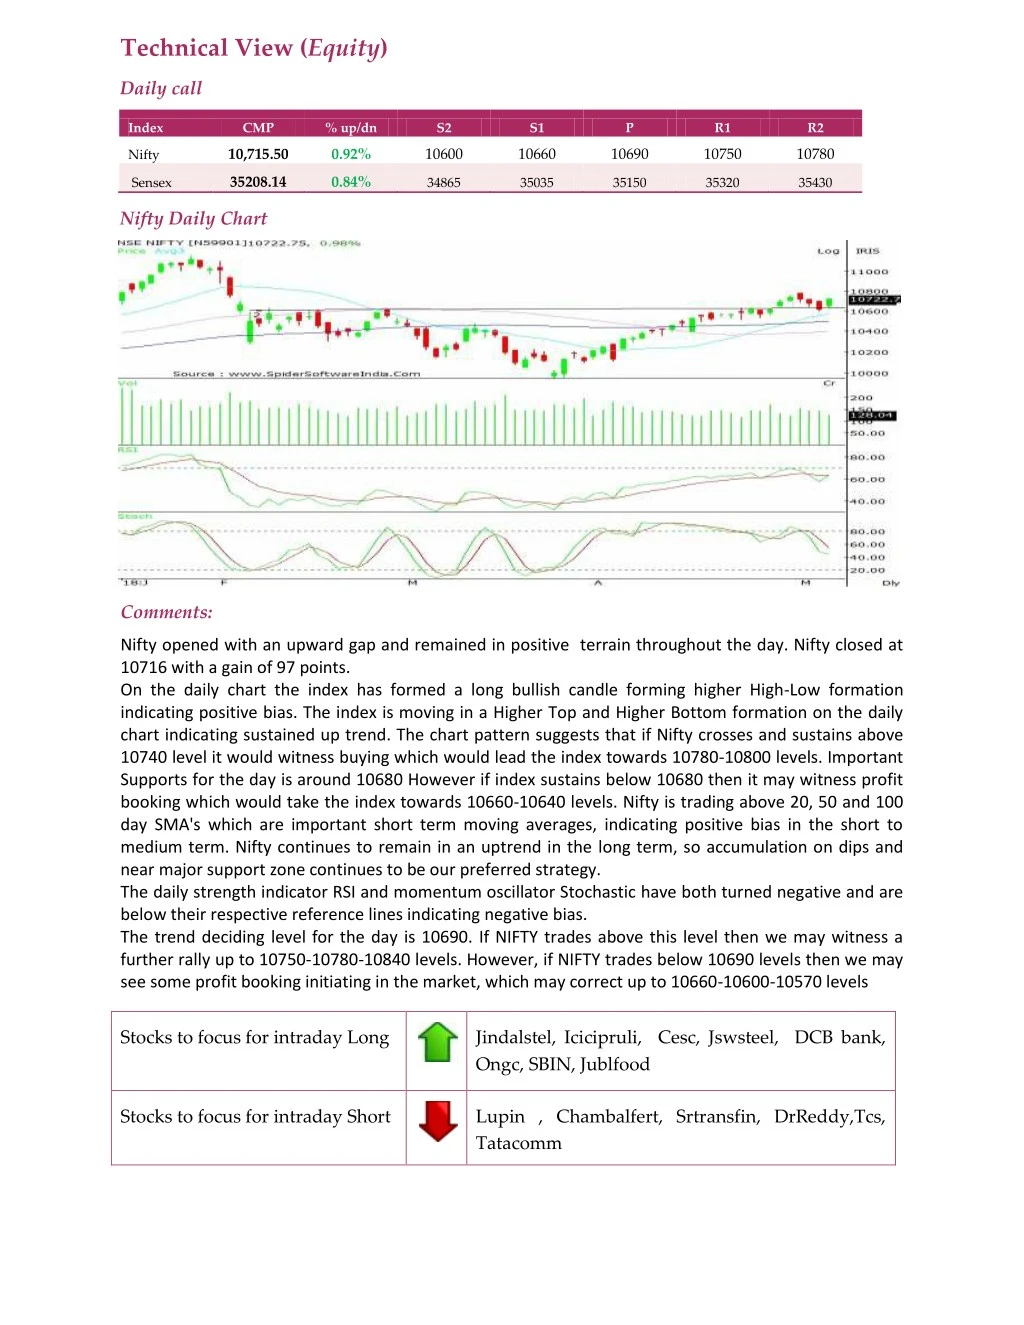
Technical View (Equity) Daily call Index CMP % up/dn S2 S1 P R1 R2 10,715.50 0.92% 10600 10660 10690 10750 10780 Nifty 35208.14 0.84% Sensex 34865 35035 35150 35320 35430 Nifty Daily Chart Comments: Nifty opened with an upward gap and remained in positive terrain throughout the day. Nifty closed at 10716 with a gain of 97 points. On the daily chart the index has formed a long bullish candle forming higher High-Low formation indicating positive bias. The index is moving in a Higher Top and Higher Bottom formation on the daily chart indicating sustained up trend. The chart pattern suggests that if Nifty crosses and sustains above 10740 level it would witness buying which would lead the index towards 10780-10800 levels. Important Supports for the day is around 10680 However if index sustains below 10680 then it may witness profit booking which would take the index towards 10660-10640 levels. Nifty is trading above 20, 50 and 100 day SMA's which are important short term moving averages, indicating positive bias in the short to medium term. Nifty continues to remain in an uptrend in the long term, so accumulation on dips and near major support zone continues to be our preferred strategy. The daily strength indicator RSI and momentum oscillator Stochastic have both turned negative and are below their respective reference lines indicating negative bias. The trend deciding level for the day is 10690. If NIFTY trades above this level then we may witness a further rally up to 10750-10780-10840 levels. However, if NIFTY trades below 10690 levels then we may see some profit booking initiating in the market, which may correct up to 10660-10600-10570 levels Stocks to focus for intraday Long Jindalstel, Icicipruli, Cesc, Jswsteel, DCB bank, Ongc, SBIN, Jublfood Stocks to focus for intraday Short Lupin , Chambalfert, Srtransfin, DrReddy,Tcs, Tatacomm