Download
1 / 1
10 likes | 27 Views
Axis Direct presents daily derivatives report presenting recommendations based on technical analysis. For trading in derivatives visit https://simplehai.axisdirect.in/offerings/products/derivatives<br>https://simplehai.axisdirect.in/share-stock-prices/nse/Lupin-Ltd-3026<br>

E N D
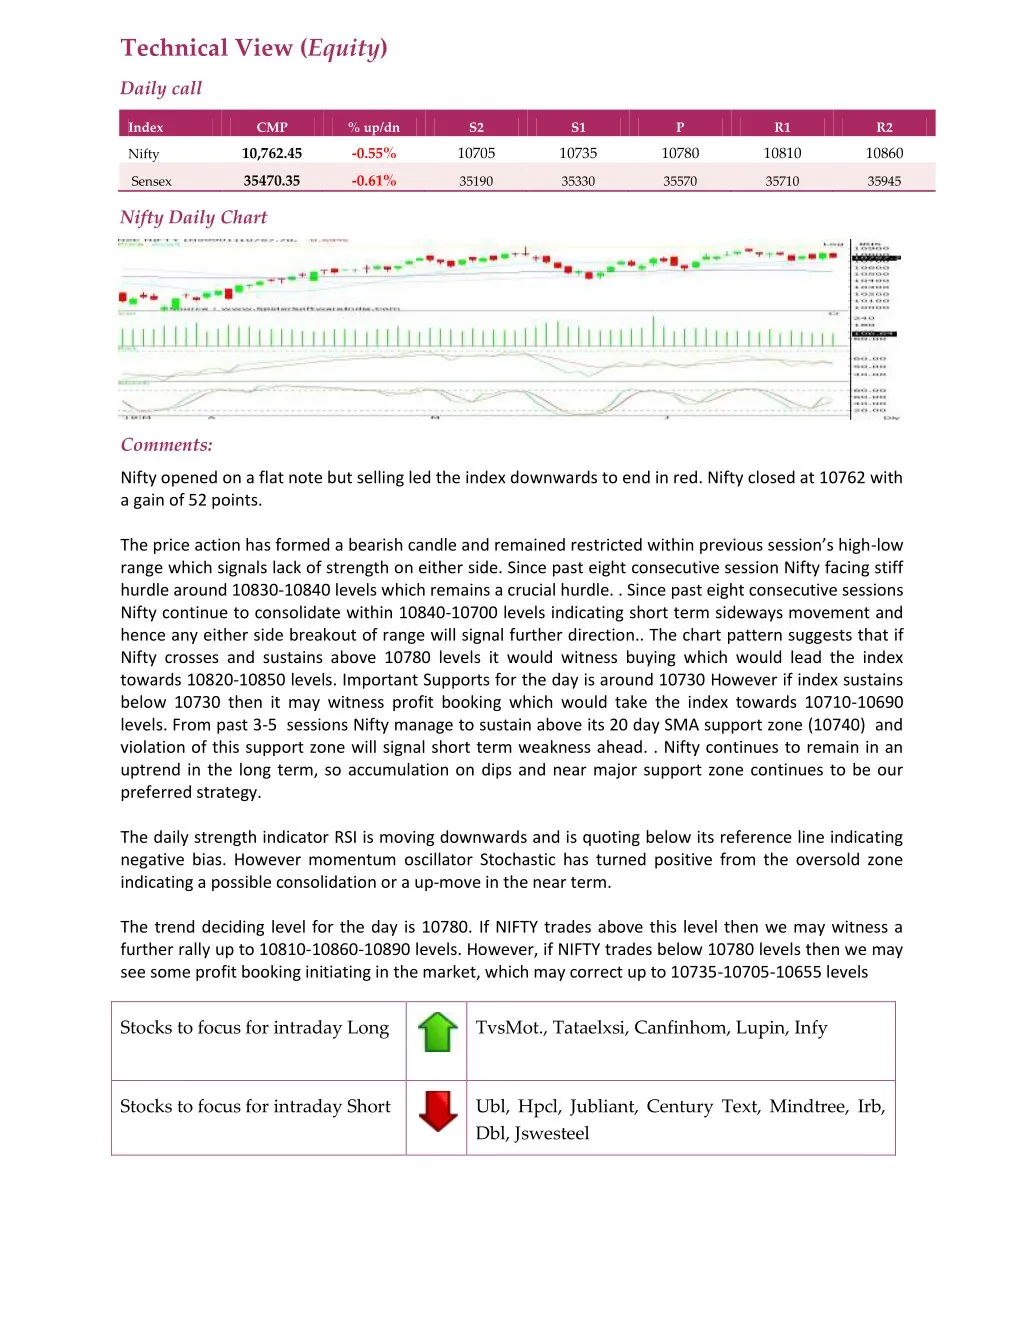
Technical View (Equity) Daily call Index CMP % up/dn S2 S1 P R1 R2 10,762.45 -0.55% 10705 10735 10780 10810 10860 Nifty 35470.35 -0.61% Sensex 35190 35330 35570 35710 35945 Nifty Daily Chart Comments: Nifty opened on a flat note but selling led the index downwards to end in red. Nifty closed at 10762 with a gain of 52 points. The price action has formed a bearish candle and remained restricted within previous session’s high-low range which signals lack of strength on either side. Since past eight consecutive session Nifty facing stiff hurdle around 10830-10840 levels which remains a crucial hurdle. . Since past eight consecutive sessions Nifty continue to consolidate within 10840-10700 levels indicating short term sideways movement and hence any either side breakout of range will signal further direction.. The chart pattern suggests that if Nifty crosses and sustains above 10780 levels it would witness buying which would lead the index towards 10820-10850 levels. Important Supports for the day is around 10730 However if index sustains below 10730 then it may witness profit booking which would take the index towards 10710-10690 levels. From past 3-5 sessions Nifty manage to sustain above its 20 day SMA support zone (10740) and violation of this support zone will signal short term weakness ahead. . Nifty continues to remain in an uptrend in the long term, so accumulation on dips and near major support zone continues to be our preferred strategy. The daily strength indicator RSI is moving downwards and is quoting below its reference line indicating negative bias. However momentum oscillator Stochastic has turned positive from the oversold zone indicating a possible consolidation or a up-move in the near term. The trend deciding level for the day is 10780. If NIFTY trades above this level then we may witness a further rally up to 10810-10860-10890 levels. However, if NIFTY trades below 10780 levels then we may see some profit booking initiating in the market, which may correct up to 10735-10705-10655 levels Stocks to focus for intraday Long TvsMot., Tataelxsi, Canfinhom, Lupin, Infy Stocks to focus for intraday Short Ubl, Hpcl, Jubliant, Century Text, Mindtree, Irb, Dbl, Jswesteel