Download
1 / 13
130 likes | 257 Views
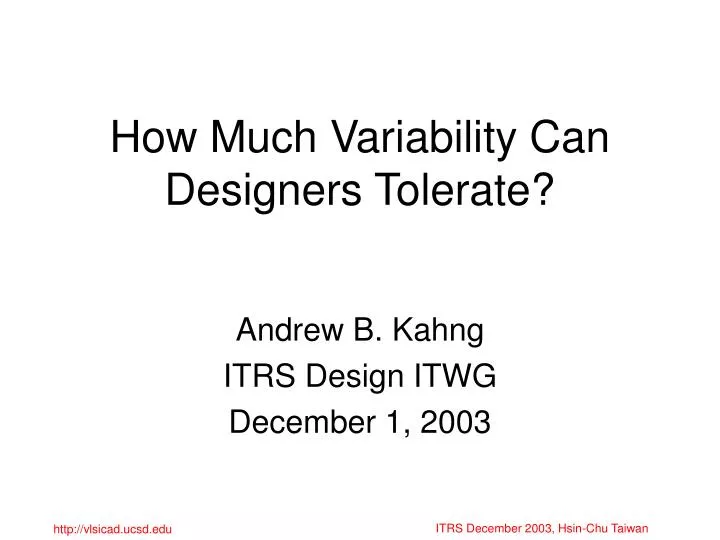
How Much Variability Can Designers Tolerate?. Andrew B. Kahng ITRS Design ITWG December 1, 2003. Variation: Across-Wafer Frequency. View #1: Designers Handle It Already. CD tolerance > 10% not a major issue

E N D
How Much Variability Can Designers Tolerate? Andrew B. Kahng ITRS Design ITWG December 1, 2003
View #1: Designers Handle It Already • CD tolerance > 10% not a major issue • Sample industry 130nm device model: Leff is nominally 80nm, 68nm for fast, 92nm for slow • already see 15% in corner analysis
View #2: Vt, Not Leff • Vt behavior already dominates gate length for circuit performance and functionality • Gate length tolerance becomes secondary to intradie Vt variation, especially at 65nm and beyond • 10% 3-sigma in linewidth does not carry same timing penalty that it used to • Practically: physical gate length tolerance < 30% • Manage capacitive load mismatches • Keep SCE-induced tolerance within non-gate length Vt variation • Intradie gate-length variation could be nearly all of this budget if active Vt control (well biasing) is used to counter mean value of SCE on each chip
Leakage Variation • Subthreshold leakage current varies exponentially with threshold voltage: I exp(-Vth) • Vth = f(channel length, oxide thickness, doping) • Most affected by variations in gate length ±100% Isub ±10% Ld Dennis Sylvester, U. Michigan
Focus on Leakage Variability • Performance fluctuations due to CD will be dominated by leakage power and not by gate delay/speed • Frequency range of 30-35% == leakage spread of 20X • Borkar (Intel), 2002 • Speed-binning: fast parts are being tossed out due to power constraints (2-sided yield problem) • Adaptive body bias or other techniques may be used to attack high leakage parts by locally raising Vth • Cost, design effort unlikely for mainstream design • But, design techniques have not even scratched the surface of possibilities
View #3: Variability Costs TTM • Poor Si correlation of performance analysis tools is partly caused by CD variation • Designers spend much effort fixing non-critical paths • Relaxing CD control would increase wasted effort • True critical paths may be overlooked • More steppings, TTM to fully ramp at target bin-split • Tighter CD control higher parameterized yield, $$ • Process guys own optimization models to determine most profitable CD control level • Must account for: Volume, Bin-Split, $$ paid to equipment suppliers to get incremental control • Expected ASP from CD control Acceptable Variability • Designers then deal with this Acceptable Variability • Guardbands, statistical performance analysis, … • Comment: Not a closed loop!
View #1 vs. View #2 vs. View #3 • View #1: Designers work around issues • Always have, always will • Variability is just another problem (and is already > 10%) • View #2: Leakage variability need adaptive biasing or threshold control anyway • Higher variability would be tolerable, especially IF gate length scaling slows AND/OR nominal channel length is set further up on the Vth-Leff roll-off curve • Would reduce impact of L uncertainty on subthreshold leakage and allow more variability to be tolerated • View #3: “Any variability is bad” • Process guys determine acceptable variability • Historical ITRS view, dominated by MPU (high-vol custom) • Comments • What is $$$ saved in process with 5% tolerance increase? • Near-zero investment to date in design tools for variability
View #4: Design-Mfg Interfaces • Increase Design awareness of Manufacturing • Restricted layout ground rules improved process window • Library-based RET performance convergence • Accurate distributions instead of Gaussians instead of corners • Awareness of through-pitch component of ACLV tighter performance analysis • Awareness of other systematic variation (etch bias...) • Many, many techniques not yet deployed • Avoid of risky structures • Understand MEEF, functional impact of geometric var • Lgate biasing for leakage, variability tolerance
View #4: Design-Mfg Interfaces • Increase Manufacturing awareness of Design • Understand designer’s intent !!! • Tolerable per-device CD errors reduced RET effort, mask cost, mask yield • Drop deterministic DOF vs. ELAT plots true statistical process windows • Functional pattern fidelity e.g., stop wasting effort on OPC of corners, other RET that has no payoff • Multilayer and function-aware rules and requirements • Fill, RET are one layer at a time wrong • Rules should distinguish critical vs. non-critical vs. dummy