Download
1 / 58
590 likes | 713 Views
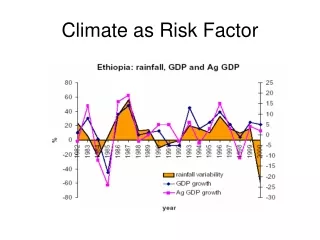
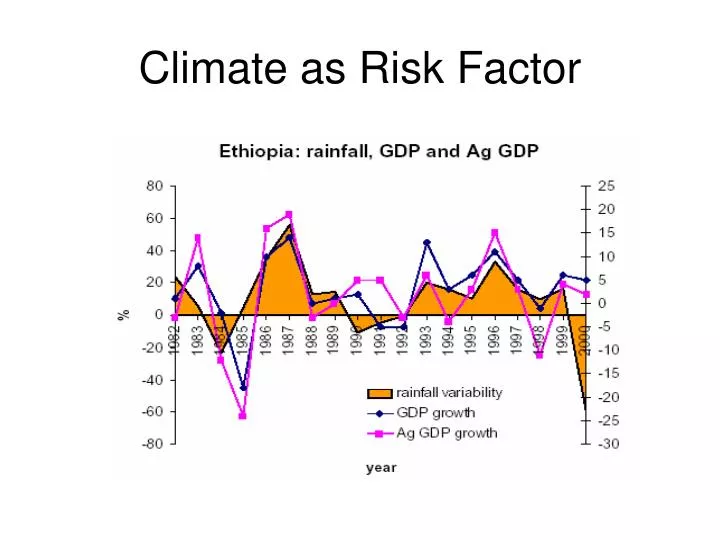
Climate as Risk Factor. Ouest African Monsoon Variability and Predictability Sylwia Trzaska International Institute for Climate and Society Earth Institute at Columbia University New York, USA With contribution of many others. Mean Seasonal Cycle Interannual Variability

E N D
Ouest African Monsoon Variability and Predictability Sylwia Trzaska International Institute for Climate and Society Earth Institute at Columbia University New York, USA With contribution of many others • Mean Seasonal Cycle • Interannual Variability • Seasonal Prediction • Operational Seasonal Forecast • IRI
West African Monsoon • Region in west Africa ca.10-20N • One rainy season July-Sept • Seasonal transequatorial south-westerly low level wind
Seasonal circulations over Africa • Seasonality of the rainfall linked to seasonal large scale circulations • SWly circulations bring moisture inland • flux convergence forces ascent and precipitation • moisture fluxes influenced by thestate of the SST and of the land surface Jul-Sept
J F M A M J J A S O N D WAfr Monsoon – Seasonal cycle Hoevmoller RR diagramme: 10E-10W Annual Rainfall totals (in mm) • AMJ – first rainy season on the coast • JAS – rainy season in the Sahel, little dry season on the coast • OND – slow southward retreat of the rainbelt, second rainy season on the coast • the installation of the rainbelt in the Sahel is NOt progressive – ‘monsoon jump’ • strong meridional gradient of annual totals; 100mm/100km • Sahel region on the edge of sustainable agriculture (ca 600mm/yr), very sensitive to small rainfall deficits
TEJ WAf Monsoon – Meridional View Source: C. Thorncroft • Intertropical discontinuity (ITD) – boundary btwn monsoon and saharan air masses • Shallow heat low to the north of ITD • Northern part of the rainbelt – intermittent convection • More sustained convection ca 10N
Rainy events Rainfall occurs within Mesoscale Convective Systems (MCS) propagating westward
SST anomalies / mean annual SST Seasonal Cycle - upwelling • JAS – equatorial and coastal upwelling in the Gulf of Guinea • Enhances meridional sea-land thermal gradient
Seasonal Cycle – Heat Low probability of occurrence Mean seasonal evolution of the Heat Low location • Climatological HL detection • ERA 40: 1967-2001 ERA 40 • 1 value / day (0600 UTC) Using the Low Levels Atmospheric Thickness (LLAT). • upper boundary :700 hPa, • top of upward wind • lower boundary :925 hPa to avoid topography below 800m • - HL occ prob- shaded • - 925hPa wind • - Horizontal wind CV - blue lines Courtesy C. Laveysse
Heat Low SAL AEJ ITCZ Cold Tongue WAfr Monsoon – mean features Source: C. Thorncroft
Mean Features and Seasonal Cycle Summary • strong meridional gradient of annual RR • meridional shift of the rainbelt • 2 rainy seasons over the coast • JAS rainy season over the Sahel • seasonal features • upwelling in Gulf of Guinea and equatorial Atlantic • heat-low over Sahara • AEJ • Rainfall within eastward progating MCS
WAfr Monsoon Variability • Rainfall Regionalization • Based on automatic classification of station data Janicot, 1991, J Clim
Sahel Rainfall – Variability 18% Variance Observed rainfall in theSahel 27% Variance 55% Variance ! Strong decadal component
WAfr Monsoon Variability • 2 initial hypotheses • Land surface feedback • ‘Charney mecanism’ • Early 70’s • Positive feedback between reduced rainfall and albedo • Reduced rainfall => reduced vegetation/desertification • => change in albedo => change in energy balance at the surface => compensation by subsidence => further reduction in rainfall • does not explain rainfall recovery in mid 70’s or late 90’s • amplitude of albedo changes needed >>observed • Sea Surface Temperatures • Atlantic Ocean - direct impact on moisture flux • unstable ENSO influence • trend linked to large scale SST gradient (interhemispheric gradient or ‘Folland mode’) and/or Indian Ocean warming • GCM forced with observed SST can successfully reproduce some of the features of Sahelian Rainfall Variability
Giannini et al. 2003, Science AGCM simulations • Models can usually capture decadal and interannual rainfall variability in the Sahel based on SST
AGCM Simulations • Early simulations by Folland et al.1986 • Rainfall response in 180d simulations forced by composite SST anomalies (exp-ctrl, in mm/day) • SST composite between Dry Sahel (1972-73,1982-84) • and Wet Sahel (1950,1952-54,1958) • Dipolar RR response to global SST forcing • Role of each basin unclear
Atlantic Ocean • Direct influence on thermal gradient and moisture fluxes • Lamb (1978) found a well defined SST anomalies in the tropical Atlantic associated with 1968 drought • Atlantic ‘Dipole’ debate in the 1990’s • 2nd EOF of tropical Atlantic Variability • ‘Dipole Index’ associated with Sahel rainfall Variability (r=0.42), Servain (1991) • Challenged by Houghton and Tourre(1992) as artifact • of EOF method • Mechanism of Wind-SST positive feedback proposed by Chang et al. (1997) but did not explain phase changes • although systematic out-of-phase variability has been ruled out Tropical Atlantic Variability is still not well understood • part of Atlantic Meridional Overturning Circulation (MOC) • Numerical studies of the influence of Atlantic SST alone did not generate significant anomalies in the Sahel, only in the coastal area (Vizy and Cook, 2001, personal experience)
Sahel-Coast Sahel- SAtl EOF Sahel – NAtl EOF Sahel – ‘global mode Sahel-ENSO Atl removed 1950-69 Sahel RR Index and SST Indices Running Window Correlations Sahel RR Index and Global SST Epoch Correlation 1970-90 Sahel-ENSO Sahel-ENSO partial (otherl removed) Relationship with SST • Strong influence of the 1982-83 ENSO Janicot et al. 2001 Clim. Dyn
Long term SST changes • Slow change in the background SST state Can this change explain change in the teleconnexions?
ENSO Interannual South Atlantic ESA Global decadal& trend North Atlantic NA Idealized SST forcing experiments • AGCM (ARPEGE-Climat) • Forced by idealized SST anomalies • Linear combinations of global SST REOF & basin forcings • Main Results: • Increase of impact of ENSO in recent context • no clear signal in Atlantic only forcing => need for larger scale anomalies • decreased Rainfall in recent global context • decreased rainfall in Indian Ocean forcing CLIVAR CLIVAR Warmer Indian Ocean influences the location of ENSO related subsidence and generates subsidence over Sahara ! Result model-dependant
Impact of the Indian Ocean • AGCM (ECHAM) forced by • observed global SST anomalies (Wet-Dry) • obs SST anomalies in the Ind Oc only • Uniform -1K anomaly in the Ind Oc • Main Results: • Increased rainfall in all cases, stronger in global and uniform Ind case Rowell (2003) Impact of E Mediterranean via moisture advection Bader and Latif, 2004, GRL
WAfr Monsoon – Land&veg feedback • SST – primary driver of the variability • Land and Vegetation feedbacks add multiyear persistenc of anomalies Zeng et al. 1999, Science
WAfr Monsoon Variability - Summary • Strong decadal component • SST primary driver of the variability • Land surface & vegetation may act as amplifiers • Multiple influences • - Atlantic • - ENSO • - Indian Ocean/interhemispheric dipole • Intstability in the teleconnections: periods of stronger Atlantic/ENSO influence • Captured by GCM forced by observed SST
XX century anomalies Future anomalies Biasutti and Giannini, 2006 WAfr Monsoon – Climate Change Inconsistency between models IPCC rainfall projection in JJA most likely change model agreement IPCC 2008 Models that reproduced late XX century drying disagree in the future
WAfr Monsoon – Seasonal Prediction • Basis – slow evolution of SST, predictability of ENSO • 2 methods • Statistical: based on statistical relationships btwn variables established on past data • Advantages : easy to establish, understand, implement • Drawbacks: fixed relationships based on past observations – unstabilities exist • Dynamical: uses GCMs, • 1tier – fully coupled models • 2 tier – atm GCM forced by predicted SST • Advantages: no prior assumptions on linkages • Drawbacks: heavily relies on abilities of GCM to correctly represent the monsoon and the teleconnections • Pbs : equatorial Atlantic Ex. Multiple regression onto 4 SST predictors (indices)
WAMME AGCM seasonal cycle Courtesy Y. Xue
GCMs and the equatorial Atlantic SST • Error in RR prediction linked to error in SST CCA btwn errors in SST and errors in RR forecats • Difficulties to predictin May the JAS equatorial Atlantic SST • Interaction btwn monsoon flow and SST in the Gulf of Guinea • Coupled models have strong systematic biases : wrong equatorial SST gradient, location of the Subtropical High Pressure Center... Goddard and Mason, 2002 Clim Dyn • In Forced modelsproblems in propagation of eq Atlantic related anomalies into Sahel (Vizy and Cook, 2001, Giannini et al, 2003, personal experience)
GCMs and Teleconections • Coupled Models do not reproduce main teleconnection patterns Observed RR-SST teleconnection patterns, • Most of the models DO simulate RR Sahel - Tropical Pacific teleconnection, some with reversed sign. Joly et al. 2007, Clim Dyn • Most of the models DO NOT simulate Teleconnection to Equatorial and Tropical S Atlantic. • Models DO NOT simulate consistent decadal variability.
JAS mean month Reynolds SST ECHAM-SOM month ECHAM-MOM month Simulation of the seasonal cycle with different SST in the Atlantic Differences with CMAP ECHAM4.5 forced, with SOM and fully coupled Mean Seasonal cycle SST Average eq-5S
PRESANOR PRES-AO (11) GHACOF (22) PRES-AC (3) SARCOF (11) Seasonal Prediction in Africa 11 years of COFs 1997-2008 (Climate Outlook Forums)
Seasonal Forecast in West AfricaPRESAO Consensus Rainfall Forecast for JAS2008 issued early June 2008 Zone 1 : Humid ; Zone 2: Very Humid; Zone 3: Normal NB: Chances of rainfall deficit are negligible Source: ACMAD
45 35 20 45 35 20 40 35 25 40 40 20 25 45 30 50 30 20 35 45 20 35 40 25 50 30 20 Seasonal Forecast in west AfricaPRESAO Statistical Hydrological Forecast for JAS2008 issued early June 2008 Source: AGRHYMET
4 « Global » Producing Centres 18 Countries African Desk GCMs Forecasts (« large» scales and SSTs) National Forecasts (« local» scales) Other Forecasts PRESAO – a consensus process Consesnsus discussion Verification Regional Forecast
NORD Sud Z NORD CENTRE SUD NA NINO EA EOF3 PREASO –National Forecasts • Statistical Method • Multiple regression on SST indices; model trained on 1960-91 period • Each country divided in several ‘zones’ • Probabilities estimated from past model performance
PRESAO – use of global products (1) Currently • Analysis of global forecasts issued by International Centers (ECMWF, UKMet, Meteo-France, NCEP, IRI etc) • Analysis of current SST statet and its forecasted evolution • Evaluation of the consistency between global and national forecasts
ROC ROC ROC Jul May Jun PRESAO – use of global products (2) In progress • Using GCM outputs via CPT – MOS correction, downscalling • Introduced since a couple of years … work in progress Ex. Evaluation of predictability in Gambia using ECHAM4.5 2-tier forecasts started in May, June and July • Importance of updates during the rainy season Courtesy Lamin Mai Touray, Dept. Water Resources, Gambia
Examples of Use of forecast Using PRESAO forecast in the food security Early Warning System in Niger Courtesy Adamou Aïssatou SITTA, DMN Niger
Examples of Use of forecast Using Seasonal Forecast for Senegal River Basin Management Manantali Dam, Senegal River • Multi-user dam • Hydropower, • flow regulation: flood control, irrigation, • water for flood recession agriculture, • minimum ecological impact Courtesy J.-P Ceron, Meteo-France
Examples of Use of forecast Using Seasonal Forecast for Senegal River Basin Management August 20 – reservoir management decision for water release for traditional agriculture Sept-Oct, given electricity and irrigation demands Sept-July Management strategy using Aug-Oct seasonal forecast made at Meteo-France end of July => Forecast water stock in the reservoir at the end of the monsoon season Courtesy J.-P Ceron, Meteo-France
Forecast Verification What hinders forecast uptake • Forecast communication (media) • Users capacity building • Forecasts tailoring • Forecasts verification • Lack of knowledge that the forecast exists • Lack of understanding of the forecast and its validity domain • Inadequate format of the forecast • Lack of confidence in the forecast Verification of forecast quality ≠ Verification of forecast Value Standard WMO recommended Methods for Probabilistic Forecast Verification: Reliability Diagram, RPSS…
Forecast Verification • 1st Attempt to Verify PRESAO product • Only 10 year sample – big sampling problem • Verification using Gridded rainfall dataset • Consistently under-forecasting above normal and overforecasting normal category • Forecasting system has capacity to discriminate btwn above- and below-normal seasons. • Better skill to predict dry than non-dry years • Skill Score indicates that PRESAO is better than climatology for JAS
FOREFITED OPPORTUNITY HARDSHIP CRISIS Managing Climate related risk • Managing the Full Range of Variability: Prevent negative outcomes in unfavorable climatic conditionsMaximize advantages in favorable climate conditions
Into the future WHY? • Lack of real use of SIP, notably because of the lack of relevant and tailored products (nature of the product, forecast period, etc.). • Needs for recalibration of statistical models used in the RCOF process so far (mainly calibrated over the 1961-1990 period), keeping in view the multi-decadal variability. • The potential of products based on Coupled General Circulation Models (CGCMs), mainly in terms of the possible forecast periods, possible range of products and future improvements. • A new WMO framework for LRF notably GPCs issuing seasonal forecasts in operational mode. • Substantial improvement in the skill can be achieved in correcting bias GCMs (notably spatial) and adapting GCM outputs in terms of relevant spatial scales for the benefit of SIP product users. • While the science of SIP indicates that one should start from the large-scale signal and large-scale forecast and then proceed to perform downscaling and tailoring the current system tends to work the opposite way (from country up-scale)
Targeted framework Large Scale Climate Information Monitoring - Forecasts ACMAD MEDIA Regional Users International Partners Regional Partners National Partners National Organisation & NGO Users NMHSs Downscaling Tailoring MWG MEDIA