Download
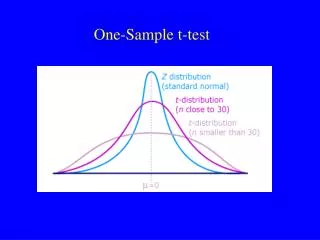
1 / 13
130 likes | 517 Views
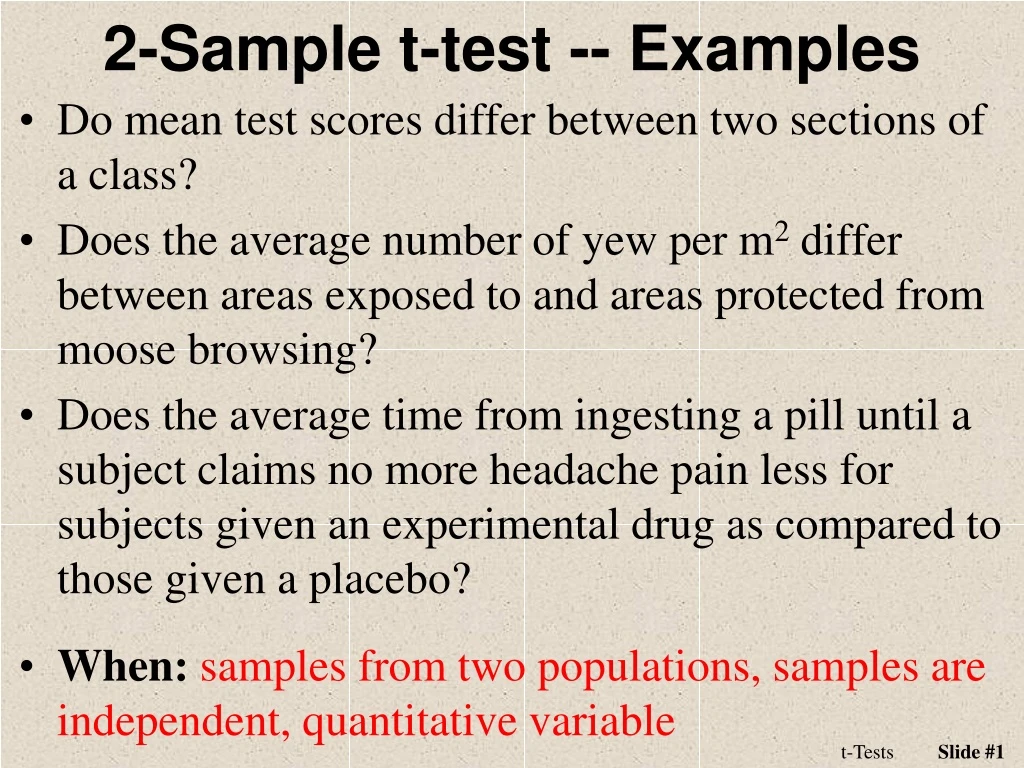
2-Sample t-test -- Examples. Do mean test scores differ between two sections of a class? Does the average number of yew per m 2 differ between areas exposed to and areas protected from moose browsing?

E N D
2-Sample t-test -- Examples • Do mean test scores differ between two sections of a class? • Does the average number of yew per m2differ between areas exposed to and areas protected from moose browsing? • Does the average time from ingesting a pill until a subject claims no more headache pain less for subjects given an experimental drug as compared to those given a placebo? • When: samples from two populations, samples are independent, quantitative variable t-Tests
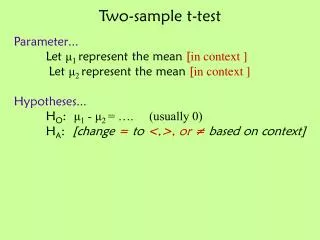
2-sample t-test • Statistic: • Ho:m1-m2=0 (which is the same as m1= m2) - 0 • Test Statistic: where sp2 is the pooled sample variance df = n1 + n2 - 2 t-Tests
2-sample t-test • Assume: • n1 + n2is large (to use a t-distribution) • n1 + n2>40, OR • n1 + n2> 15 and bothhistograms are not strongly skewed, OR • bothhistograms are approximately normal • the two samples are independent • s12 = s22 • Are s12 & s22 parameters or statistics? • Hypothesis Test -- Levene’s Test • Ho: s12 = s22 vs Ha: s12 s22 • What do you do with the p-value? t-Tests
Levene’s Test Summary • A hypothesis test within a hypothesis test. • Small p-values mean the variances are unequal. • If Levene’stest is a reject, can not continue with the 2-sample t-test (as presented here). t-Tests
A Full Example • A study of the effect of caffeine on muscle metabolism used 36 male volunteers who each underwent arm exercise tests. Eighteen of the men were randomly selected to take a capsule containing pure caffeine one hour before the test. The other men received a placebo capsule. During each exercise the subject's respiratory exchange ratio (RER) was measured. [RER is the ratio of CO2 produced to O2 consumed and is an indicator of whether energy is being obtained from carbohydrates or fats]. The question of interest to the experimenter was whether, on average and at the 5% level, caffeine changed mean RER. t-Tests
A Full Example Group n Mean StDevMin 1stQu Median 3rdQuMax Caffeine 18 94.22 4.870 84.0 93.00 94.00 96.75 105.0 Placebo 18 100.10 5.795 89.0 96.25 100.50 103.00 109.0 Levene’sTest p-value = 0.1993 Caffeine Placebo 6 6 4 4 Frequency Frequency 2 2 0 0 80 85 90 95 100 85 90 95 100 110 105 105 RER RER t-Tests
Recipe for any Hypothesis Test 1) State the rejection criterion (a) a=0.05 2) State the null &alternative hypotheses, define the parameter(s) Ho: mc-mp= 0 Ha: mc-mp 0 where mc is mean RER for all males given the caffeine pill mpis mean RER for all males given the placebo Inference Concepts
Recipe for any Hypothesis Test 3) Determine which test to perform – Explain! 2-sample t-test … because … (a) two populations were considered (caffeine and placebo groups), (b) the populations are independent (there is no connection between males in the two groups), and (c) a quantitative variable (RER) was recorded. 4) Collect the data (address type of study and randomization) (i) Experiment (pill was controlled by experimenter to form treatments) (ii) Random allocation of individuals to treatments, but not random selection from population for inclusion in the experiment Inference Concepts
Recipe for any Hypothesis Test 5) Check all necessary assumption(s) • nc+np = 18+18 = 36 >15 and histograms not strongly skewed (ii) Two samples are independent Caffeine Placebo 6 6 4 4 Frequency Frequency 2 2 0 0 80 85 90 95 100 85 90 95 100 110 105 105 RER RER Inference Concepts
Recipe for any Hypothesis Test 5) Check all necessary assumption(s) [cont] (iii) Variances are equal 2. Ho: Variances are equal Ha: Variances are not equal 3. Levene’s Test 8. p-value = 0.1993 9. p-value > a (0.05) … DNR Ho 10. Variances appear to be equal Inference Concepts
6) Calculate the appropriate statistic(s) `xc -`xp = 94.22-100.10 = -5.88 7) Calculate the appropriate test statistic Group n Mean StDevMin 1stQu Median 3rdQuMax Caffeine 18 94.22 4.870 84.0 93.00 94.00 96.75 105.0 Placebo 18 100.10 5.795 89.0 96.25 100.50 103.00 109.0 df = 18 + 18 – 2 = 34 t-Tests
Recipe for any Hypothesis Test • > 2*distrib(-3.307,distrib="t",df=34) • [1] 0.002233631 8) Calculate the p-value 9) State your rejection decision p-value (0.0022) < a (0.05) …. Reject Ho 10) Summarize your findings in terms of the problem The mean RER appears to differ between the males that received the caffeine pill and those that received the placebo. Inference Concepts
Recipe for any Hypothesis Test 11) If rejected H0, compute a 100(1-a)%confidence region for parameter (i) 100(1-0.05)% = 95% (ii) Interval … because Ha was not equals (iii) t* = ±2.032 … from (iv) -5.88 ± 2.032*1.778 -5.88 ± 3.61 (-9.49, -2.27) (v) I am 95% confident that the mean RER for those that received the caffeine pill is between 2.27 and 9.49 units lower than for those that received the placebo. • > ( distrib(0.025,distrib="t",df=34,type="q") ) • [1] -2.032245 Inference Concepts