Download
1 / 27
290 likes | 447 Views
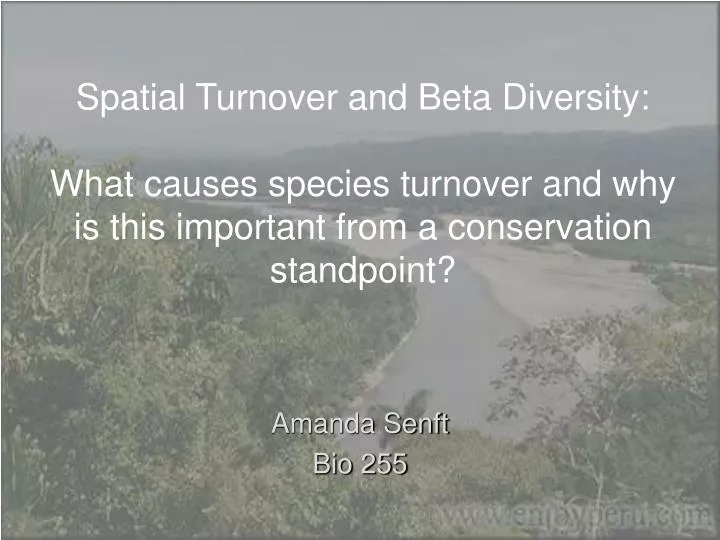
Spatial Turnover and Beta Diversity: What causes species turnover and why is this important from a conservation standpoint?. Amanda Senft Bio 255. Beta Diversity (species turnover through space).

E N D
Spatial Turnover and Beta Diversity:What causes species turnover and why is this important from a conservation standpoint? Amanda Senft Bio 255
Beta Diversity (species turnover through space) • Previously, we discussed how to measure beta diversity…. but what processes are we measuring? In other words, what causes beta diversity? • When we conserve areas of high beta diversity (biogeographic crossroads), are we conserving: • Areas of high species turnover? OR • The processes causing this high species turnover?
Whittaker (1960) NON - GRADIENT GRADIENT β=γ/α Half changes Similarity v. distance Harrison Wilson & Schmida Cowling Willig & Sandlin Blackburn & Gaston Oliver Young Pharo….. Cowling Rey Benayas Porembski Harrison Nekola & White Cody Syuzo Givnish….. Slide stolen from Meghan with an H
What causes beta diversity? From Duivenvoorden et al 2002
Dispersal limitation I= # seeds per area P= probability that a seed predator won’t get the seed PRC=population recruitment curve: distance from adult that its offspring is likely to appear From Janzen 1970
How did Condit et al consider beta diversity? • Similarity in species composition as a function of distance. • All pairs of plots considered together. • Spatial heterogenity (e.g. ecotones) not considered in null model • Tested Dispersal Limitation as a major driving force
How did Spector consider beta diversity? • Caused by environmental factors: geological, climatic, geometric features • Preserved by evolutionary factors: • Ecotones are “evolutionarily active zones”…see Enserink 1992 • and by “underlying processes” • Fire or another ecological gradient • But…considered only a single scale
Today’s papers… Condit, R., Pitman, N., Leigh, E. G., Chave, J., Terborgh, J., Foster, R. B., Nunez, P., Aguilar, S., Valencia, R., Villa, G., Muller-Landau, H. C., Losos, E., and S.P Hubbell 2002. Beta-Diversity in Tropical Forest Trees. Science 295(5555): 666-669. Spector, S. 2002. Biogeographic Crossroads as Priority Areas for Biodiversity Conservation. Conservation Biology. 16(6): 1480-1487.
How do you measure ecological distance between 2 sites? A B Distance metrics: Similarity between plots Sorenson 2w / A+B : Shared abundance over total abundance Jaccard w / A+B-w: Proportion of combined abundance not shared Other distance measures they could have used: Euclidean, Correlation distance, Mahalenobis, Chi-square Probability metric using null model: Probability: F=Σfi1 f j2 The sum of the abundance of a spp at site 1 times abundance at site 2 for all species. Probability that two trees chosen randomly from 2 plots are of the same species. Takes into account relative abundance of species. w
In Panama, plots within 1 km very similar, but very different from plots 50 km away • In Peru and Ecuador, plots within 1 km nearly as similar as plots 50 km away • Panama: Species turnover due to environmental factors: climate, geology, soil • Peru and Ecuador: Species turnover due to dispersal limitation
Null model based on a Bessel function of decay: • Null hypothesis: Only dispersal and speciation affect spp distributions. • Used Hubbell’s null model: all spp identical in death, reproduction, dispersal, speciation=extinction, etc. • Probability that 2 individuals r kilometers apart are the same species is a function of distance, speciation, dispersal distance and tree density.
Condit et al Figure 2 • Graphs showing experimental (points) vs. theoretical decay of species similarity with distance • - Variance is higher for Panama • Decay in similarity from 0-100 m not well simulated by model
Condit et al Figure 2 • Graphs showing experimental (points) vs. theoretical decay of species similarity with distance • - Variance is higher for Panama • Decay in similarity from 0-100 m not well simulated by model
Condit et al Figure 2 • Graphs showing experimental (points) vs. theoretical decay of species similarity with distance • - Variance is higher for Panama • Decay in similarity from 0-100 m not well simulated by model
Conclusions from Condit paper: • Species more aggregated than dispersal theory predicts • Abundant species not well modeled with dispersal theory (they’re just everywhere, regardless of distance) • Null model of dispersal works well for distances .2-50 km, but other factors influence beta diversity at different scales
Duivenvoorden et al: Variance partitioning • Using Condit’s data, found that (linear) distance, elevation, precipitation, stand age and bedrock type were all significant predictors of species similarity. • Still, distance and environment together explained left 59% of floristic variation unexplained • A re-reanalysis using presence-absence data instead of abundances, and log distances, was able to leave only 41% of data unexplained (Ruoklainen and Tuomisto, 2002).
Spector paper • We should conserve “biogeographic crossroads” where there is high species turnover: • Areas meet goals of representativeness and complementarity • Conserve evolutionary processes: speciation and coevolution • Congruence assumed to be high: • Environmental factors act on most taxa to create zones of high turnover Scarab beetle
How have others considered biogeographic crossroads? • Clements 1905: Tension zones where principle species from adjacent communities meet • Delcourts (numerous): shifting ecoclines
Sky Islands (stacked biotic communities)… Marshall 1957 cited by Warshall 2003
Spector’s Caveats • Ecotones harbor species at the edges of their ranges, which are often more fragmented, more extinction prone (is this true or not?) • Park size should equal the size of the ecological gradient and processes maintaining the ecotone. How does one quantify this?
Discussion questions… • Do “biogeographic crossroads” exist? At what scale? • Given that ecotones often mark the edge of a given species’ range, should we mark areas of high species turnover for conservation? Consider also that ecotones are predicted to be highly sensitive to climate change (Turner, Gardner, and O’Neill 1991). • What caused the differences in diversity patterns between Panama and the two South American sites? • Which variables predicted beta diversity in the Tropics? How transferable are those results?