Download
1 / 14
140 likes | 268 Views
Climate Data Records and Science Data Stewardship: Playing for Keeps. Bruce R. Barkstrom National Climatic Data Center NOAA. Outline. What are CDRs An Example General Characteristics What’s Involved in SDS Assuring that the data and context are valuable to the future

E N D
Climate Data Records and Science Data Stewardship: Playing for Keeps Bruce R. Barkstrom National Climatic Data Center NOAA
Outline • What are CDRs • An Example • General Characteristics • What’s Involved in SDS • Assuring that the data and context are valuable to the future • Making sure data are ready to preserve • Making sure data and context will be useful • Making sure data and context will survive • Being cost effective
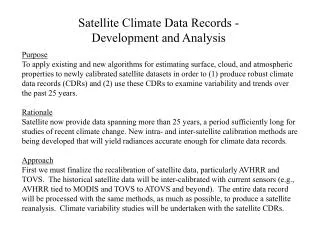
An Example CDR – Solar Constant • Original data cover several decades • Multiple data sources • Work needed: • Physical model of causes of differences • Development of homogeneous data set versions • Estimation of detectable variability and trends
CDR Characteristics • Covers long time period (decades or more if possible) • Likely to have multiple data sources • Every attempt to deal with errors on a physical basis • Every attempt to make errors homogeneous over record • Software must have full configuration management • Input data sources should be as homogeneous as possible • Intent is to provide • Quantified variability: Cumulative Distribution Functions (CDFs) of parameter variations, not only for global averages, but also regional values and extreme value statistics • Quantification of Change Detection: Ability to test observed CDFs against expected CDFs of potential changes
How Do We Assess the Value of a CDR? • 3 Approaches: • Cost of Acquiring CDR • Cost of Reconstruction – if possible Need to have original data, need to assemble hardware and software, need to run (maybe 2 or 3 million jobs) • Present Value of Future Use Economists discount future benefits at 7%
Valuation is Tough • OMB Question: Why do we need more than $2B/year for climate? • CCSP and CEOS both have had trouble prioritizing • Probably two scales of value • Scientific “Value” – represented by “Bretherton Issues” • Societal Benefit – represented by reduction in damage, lives saved, new industries created • Quantifying to OMB’s satisfaction is difficult • Question 1: Can CI help with justifying priorities?
Good Archival Practice • ISO Standard for “What an Archive Should Do for Long-Term Preservation” • OAIS Reference Model • Recommendation: • Prepare a Submission Agreement between an Archive and a Data Provider • Evaluate condition and completeness of candidate data and metadata • Plan work required to repair deficiencies • SDS Preferred Approach – use “Maturity Model”
Maturity Model • Evaluate Maturity 3 ways: • Scientific Maturity • Preservation Maturity • Societal Benefit • For Each Axis: • Reduce evaluation to non-dimensional scaling of attributes • Ask for evaluation from experts • Question 2: Can CI help with evaluation of maturity?
Work Required to Produce CDRs • Evaluation of Available Record for Gaps and Understandability • Gaps • Documentation • Evaluation of Candidate CDR Uncertainties • Error Sources Considered • Calibration and Validation • Evaluation of Record Repair Work • Gaps • Recalibration • Uncertainty Estimation
Roles of Satellite Data and In-Situ Data • In-situ Data Complements Satellite Data • Satellites for coverage – although challenge is getting adequate length of record • In-situ for calibration and validation • For Data Stewardship • Need preservation of context: cal-val data preservation, source code, documentation of procedures, metadata • Results of intercomparisons should have measurable improvement in uncertainty
Some Thoughts on Quantifying Impact of In-Situ Data • Errors in satellite measurements • Estimates should be based on physical causes • Stewardship needs way of making publically available – and accomodating changes in assessments by community over time • Statistical in nature • Delimited by time interval and spatial region • Most rigorously specified as CDF of error • Might be simply specified in terms of std dev of error about “average” measured value • Cal-Val efforts should improve “error bars” • Stringency: ratio of error dispersion about mean after cal-val to dispersion before • 1 – no improvement; 2 to 5 – moderate improvement; >10 – really stringent requirement on cal-val • Related to number of independent samples in cal-val set • Plausibility: significance of improvement • Unsuspicious – p of difference 20%; Somewhat convincing – p ~ 5%; Fairly confident – p ~ 1% • Number of iterations in reprocessing • Inversely proportional to experience • Increases with required stringency and plausibility • Question 3: Can CI help evaluate proposed In-Situ Validation Data Sets for Error Reductions, Stringency, and Plausibility?
The Odds for Long-Term Preservation • Preservation inclines one toward pessimism • If p is annual probability of survival and • N is number of years to survive • Probability of survival is (1 – p)**N • To have 99% probability of survival for 200 years, requires p = 5. E -05 • Standard approach to reducing risk • Assess mechanisms of loss • Quantify annual probability of loss and probable value of loss [note return to valuation issue] • Find affordable risk mitigation approach
Science Data Stewardship:What are the Odds • Important Risks • IT Security Incidents • 10% per year probability; maybe 10% of collection at risk of corruption (p = 1%/yr – need dispersion acrosss systems) • Operator Error • 10% per year probability; loss depends on time operators work and degree of automation (p = 1%/yr – need QA) • Hardware or Software Error • 5% per year probability; loss as in operator error • Hardware or Software Obsolescence • 100% probability of loss in 5 to 10 years (p = 20%/yr) • Suggests treating expenses of hardware and software replacement as “insurance expenses” – not assets
Science Data Stewardship:How Do We Improve the Odds? • SDS will require several new things: • Making the history and details of data provenance public (anything proprietary dies) • Capturing now-tacit knowledge before it disappears (knowledge not captured dies when the knower retires, gets sick, or dies) • Creating methods of tracing the evolution of data, metadata, and assessments of same • Expectation: SDS grants program provides avenue for bringing in ideas that • improve information survivability • reduce cost of archival • make data and context more useful for those that come after • If we don’t succeed, we’ve all been publishing in The Journal of Irreproducable Results