Download
1 / 40
400 likes | 576 Views
Data Mining Techniques in Support of Science Data Stewardship. Eric A. Kihn , M. Zhizhin NOAA/NGDC RAS/CGDS. Presentation outline. I. Background for the talk II. What is science data stewardship? III. What is data mining? IV. Techniques for SDS IV. Conclusions.

E N D
Data Mining Techniques in Support of Science Data Stewardship Eric A. Kihn, M. Zhizhin NOAA/NGDC RAS/CGDS
Presentation outline I. Background for the talk II. What is science data stewardship? III. What is data mining? IV. Techniques for SDS IV. Conclusions
Motivation for this presentation? • Present an innovative technology application to a new community • Show different methods for accessing and characterizing data • Present some interesting results in area of employing intelligent systems to support environmental data archives
What is being presented • A set of tools and techniques developed or utilized at the National Geophysical Data Center • A system meant to mimic the expertise of a subject matter expert (SME) • Some key concepts such as fuzzy logic, data mining, knowledge tools.
Nature June 10, 1999 • “It’s sink or swim as a tidal wave of data approaches. … Are scientists ready for the flood?” • “Most researchers are accustomed to studying a relatively small data set for a long time, using statistical models to tease out patterns. At some fundamental level that paradigm has broken down.” • NASA’s EOS exceeds 1 Tb/Day • CERN exceeds 20 Tb/Day • The internet as a distributed data source provides 100’s of petabytes.
Ph.D’s and Networked Data • The number of eyes looking at data remains constant. • The amount of data tends to follow Moore’s law. • In order to turn data into knowledge new techniques are required. Nature June 10, 1999
NGDC Holdings - % Mbytes by Data Type Data archived as of September 2002 SOLAR-TERRESTRIAL PUBLICATIONS < 1% LAND GEOTHERMAL < 1% LAND GRAVITY < 1% COSMIC RAY < 1% MARINE GEOLOGY 1% LAND GEOCHEMISTRY <1% HAZARDS 2% AURORA <1% SOLAR 7% BATHYMETRY, TOPOGRAPHY, & RELIEF 8% SATELLITE - GOES, NOAA TIROS 24% ECO SYSTEMS 9% ALL OTHER 3% SIDE SCAN SONAR 16% MARINE TRACKLINE + OTHER MARINE 10% GEOMAGNETISM 10% IONOSPHERIC 12% DMSP SATELLITE DATA 97%
Why the emphasis on data mining now?Answer: Layers of data archives • Standard Metadata • Access methods (i.e. XML) • Enterprise organization of data • Data quality control • Local holdings
Levels of Information Analysis • Simulation/Optimization • Forecasting • Segmentation • Model Building • Hypothesis Testing • Statistics • Conditional Climatology • Visualization • Climatology • Percentages • Counts & Sums • Queries
NGDC's Science Data Stewardship Vison Society Analysis Knowledge Quality Control Scientists Research Quality Data User Requirements Users Productization Skilled Users Techniques Processing, Calibration Mission Scientists Raw Data Collection and Storage
Definition of Data Mining Data mining (also known as Knowledge Discovery in Databases - KDD) has been defined as "The nontrivial extraction of implicit, previously unknown, and potentially useful information from data"[1] It uses machine learning, statistical and visualization techniques to discovery and present knowledge in a form which is easily comprehensible to humans.
Application to Environmental Data • Data quality control • Human linguistic translation • Event and trend detection • Data classification • Forecast • Deviation detection
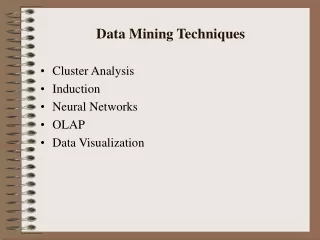
Categories of Knowledge Tools • Reporting and OLAP • Theory driven modeling: • Correlations • t-tests • ANOVA • Linear Regression • Logistic Regression • Discriminant Analysis • Forecasting Methods • Data driven modeling: • Cluster Analysis • Factor Analysis • Decision Trees • Fuzzy Classifier • Neural Networks • Association rules • Rule induction 2-D Fuzzy C-Means Clustering
Why Fuzzy Logic? Fuzzy logic is a supersetof conventional (Boolean) logic that has been extended to handle the concept of partial truth -- truth values between "completely true" and "completely false". It was introduced by Dr. Lotfi Zadeh of UC/Berkeley in the 1960's as a means to model the uncertainty of natural language. Natural language (like most other activities in life and indeed the universe) is not easily translated into the absolute terms of 0 and 1. Fuzzy logic lets computers function closer to the way our brains work. We aggregate data and form a number of partial truths which we aggregate further into higher truths which in turn, when certain thresholds are exceeded, cause certain further results such as motor reaction.
Fuzzy-Logic • Jim is 5’2” (157 cm) tall. Is Jim tall? • Boolean Logic - “NO” (0) • Fuzzy-Logic - “Jim is .082 tall” (.082) • Major Advantages: • Allows more realistic (natural) definition of sets • More graceful handling of boundaries/intersections • Provides more human-like searching • Fuzzy-Logic does NOT impact the data. It is simply a classification technique for selecting the most relevant data, given a set of complex conditions.
Definition of a fuzzy set Classical set A in X is a set of ordered pairs defined by indicator function Fuzzy set A in X is as a set of ordered pairs defined by membership function
Fuzzy logic Fuzzy NOT First operand: fuzzy set A Fuzzy AND Second operand: fuzzy set B Fuzzy OR
“High” Wind “Average” Temperature “About” 60% Humidity
What is fuzzy clustering? • In non-fuzzy or hard clustering, data is divided into crisp clusters, where each data point belongs to exactly one cluster. • In fuzzy clustering, the data points can belong to more than one cluster, and associated with each of the points are membership grades which indicate the degree to which the data points belong to the different clusters.
Types of Fuzzy Cluster Algorithms • Classical Fuzzy Algorithms (cummulus like clusters) • The fuzzy c-means algorithm • The Gustafson-Kessel algorithm • The Gath-Geva algorithm • Mountain and Subtractive • Linear and Ellipsodial (lines) • The fuzzy c-varieties algorithm • The adaptive clustering algorithm • Shell (circles,ellipses, parabolas) • Fuzzy c-shells algorithm • Fuzzy c-spherical algorithm • Adaptive fuzzy c-shells algorithm
Mountain fuzzy clustering algorithm • Form a grid on the data space; intersections are candidates for cluster centers • Construct mountain function representing data density • Sequentially destruct the mountain function: • Make dent where highest values are (each data point contributes to the height) • Subtracted amount inversely proportional to distance between v and c1 and height m(c1)
2D density mountains Mountain function with b) σ=0.05 c) 0.1 d) 0.2
2D mountain clustering Mountain destruction with β=1 b) first cluster c) second d) third
Mountain fuzzy clustering • No need to set number of clusters a priori • Simple, but computationally expensive • May be used to generate fuzzy rules relating the variables (knowledge discovery) • May be generalized to subtractive clustering Yager, R. and D. Filev, "Generation of Fuzzy Rules by Mountain Clustering," Journal of Intelligent & Fuzzy Systems, Vol. 2, No. 3, pp. 209-219, 1994.
Subtractive clustering The method assumes each data point is a potential cluster center and calculates a measure of the likelihood that each data point would define the cluster center, based on the density of surrounding data points: • Selects the data point with the highest potential to be the first cluster center • Removes all data points in the vicinity of the first cluster center, in order to determine the next data cluster and its center location • Iterates on this process until all of the data is within radii of a cluster center
Subtractive clustering advantages • No grids in the parameter space: computationally efficient • Fuzzy clusters centered at the observation points: real modes selection • May be used to generate fuzzy rules relating the variables (knowledge discovery) Chiu, S., "Fuzzy Model Identification Based on Cluster Estimation," Journal of Intelligent & Fuzzy Systems, Vol. 2, No. 3, Sept. 1994
Data Quality Control Sample station data used in the SWR effort. The Space Weather Reanalysis a long term re-analysis requires careful quality control of a huge volume of data. A single instance of bad data can have ripple effects throughout the entire model run. Working with satellite and station data in particular can be tricky, with spikes, baseline shifts, dropouts all prominent in the data stream. In a typical small scale study it would be possible for a researcher to hand screen the data, but here the volume requires the application of “intelligent” computer techniques, based on fuzzy-logic, neural computing and other mathematical functions.
Some Preliminary Results Scenario: Boulder for Mid October Parameters Studied: Temperature (surface), Relative Humidity Impacts: Scenario represents likely impacts on an IR sensor instrument. Data Source: NCEP Reanalysis (20 years) Technique: Subtractive Clustering
Conclusions • Increasing data volumes demand new tools and methods • Mathematical methods exist which, provide analysis, classification and forecast methods for large data volumes • Fuzzy based systems hold great promise as knowledge extraction tools.
Resources • An excellent introductory article is: • Bezdek, James C, "Fuzzy Models --- What Are They, and Why?", IEEE Transactions on Fuzzy Systems, 1:1, pp. 1-6, 1993. • Books • Fuzzy Cluster Analysis, Hoppner et al • Neuro-Fuzzy and Soft Computing, Jang et al • Fuzzy Logic , Yen • System Identification, Ljung • Web • The Environmental Scenario Generator • http://esg.ngdc.noaa.gov • Data Mining and Knowledge Discovery • http://www.digimine.com/usama/datamine/