Download
1 / 43
590 likes | 891 Views
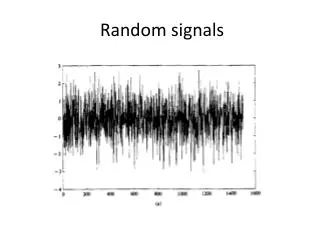
Noise and Random Telegraph Signals in Nanoelectronic Devices. Zeynep Çelik-Butler Electrical Engineering Department University of Texas at Arlington Arlington, Texas, 76019 celikbutler@ieee.org.

E N D
Noise and Random Telegraph Signals in Nanoelectronic Devices Zeynep Çelik-Butler Electrical Engineering Department University of Texas at Arlington Arlington, Texas, 76019 celikbutler@ieee.org
Motivation: Problems Encountered as the Devices Shrink, Frequencies Increase, and Voltages Reduce Improved Model for 1/f Noise in MOSFETs Random Telegraph Signals in MOSFETs Complex RTS Extraction of trapping parameters using RTS Outline Noise and Reliability Laboratories, Zeynep Celik-Butler, celikbutler@ieee.org
6' x 6' x 8' Shielded Room 3 Spectrum and Signal Analyzers, f=1 mHz - 20 GHz. 3 Cryostats, T= 2 K to 350 K. UTA - Noise Characterization Facilities • Various Lock-ins, Preamps, System Controllers, Battery Operated Sources etc. • Optical Equipment • Computer Software for Modeling Noise and Reliability Laboratories, Zeynep Celik-Butler, celikbutler@ieee.org
Problems Encountered as the Devices Shrink, Frequencies Increase, and Voltages Reduce • Signal-to-noise ratio decreases. • Noise models based on large number of electrons break down. • Quantum effects become dominant. Noise and Reliability Laboratories, Zeynep Celik-Butler, celikbutler@ieee.org
Signal to Noise Ratio Decreases • For a MOSFET • Start from W=100mm, L=10mm, tox=800Å, NSS=4x10¹⁰ eV-1cm-2. • Assume scaling factor is K. • Assume trap and surface state densities remain the same. • Increase in noise level due to the K1/2 law chosen for tox. • Unpredictability of noise level for K>20. • NSS is actually a two dimensional Poisson variable. Noise and Reliability Laboratories, Zeynep Celik-Butler, celikbutler@ieee.org
EC kT=26 meV EF EV Si 1 trap per channel SiO2 Large Area Noise Models Break Down • Single electron, single trap effects. NSS=4x10¹⁰ eV-1 cm-2, W=1mm, L=0.1mm. Noise and Reliability Laboratories, Zeynep Celik-Butler, celikbutler@ieee.org
Large Area Noise Models Break Down Break-down of large-area models for sub-micron channel length. • A=Nt (cm-3 eV-1) • B=ameffNt (cm-1 eV-1) • C=a2meff2Nt (cm eV-1) • A=B2/(4C) Independent parameters: aand Nt Noise and Reliability Laboratories, Zeynep Celik-Butler, celikbutler@ieee.org
Large Area Noise Models Break Down Vgs-VT= -1 V Vds= -50 mV Noise and Reliability Laboratories, Zeynep Celik-Butler, celikbutler@ieee.org
Large Area Noise Models Break Down Noise and Reliability Laboratories, Zeynep Celik-Butler, celikbutler@ieee.org
Large Area Noise Models Break Down Modified 1/f noise model that takes into account threshold variation along the channel. • For simplicity assume two regions: • DV, DL, VT2,, A2, B2, C2 • Vds-DV, L-DL, VT1, A1, B1, C1 • DL<<L, VTVT1 • A1 = A2, since Nt1 = Nt2 • B12/C1 = B22/C2 = 4A • I1 = I2 = Id • meff1 = meff2, Independent parameters: Nt, a1, a2, VT2, and DV Noise and Reliability Laboratories, Zeynep Celik-Butler, celikbutler@ieee.org
Large Area Noise Models Break Down Modified 1/f noise model that takes into account threshold variation along the channel. Noise and Reliability Laboratories, Zeynep Celik-Butler, celikbutler@ieee.org
RTS in MOSFETs Random Telegraph Signals: single electron switching. t1 DId t0 Noise and Reliability Laboratories, Zeynep Celik-Butler, celikbutler@ieee.org
PSD Time Scale seconds Frequency (f) Time Scale milliseconds RTS in MOSFETs Random Telegraph Signals (RTS) with a Lorentzian on 1/f spectum. Noise and Reliability Laboratories, Zeynep Celik-Butler, celikbutler@ieee.org
1 RTS process 2 RTS levels Noise and Reliability Laboratories, Zeynep Celik-Butler, celikbutler@ieee.org
2 RTS processes 3 RTS levels Noise and Reliability Laboratories, Zeynep Celik-Butler, celikbutler@ieee.org
4 RTS processes 5 RTS levels Noise and Reliability Laboratories, Zeynep Celik-Butler, celikbutler@ieee.org
COMPLEX RTS Complex random telegraph signals due to multiple traps Noise and Reliability Laboratories, Zeynep Celik-Butler, celikbutler@ieee.org
RTS in MOSFETs RTS can be used to characterize trapping sites. RTS modeling. Noise and Reliability Laboratories, Zeynep Celik-Butler, celikbutler@ieee.org
RTS in MOSFETs RTS can be used to characterize trapping sites. • Position of the trap along the channel, yT • Position of the trap in the oxide, xT • Trap energy, ECox - ET • Screened scattering coefficient, a Noise and Reliability Laboratories, Zeynep Celik-Butler, celikbutler@ieee.org
Trapping Parameters Through RTS in MOSFETs yT/L=0.6 ECox-ET=3.04 eV xT=2.7 nm Noise and Reliability Laboratories, Zeynep Celik-Butler, celikbutler@ieee.org
Trapping Parameters Through RTS in MOSFETs Noise and Reliability Laboratories, Zeynep Celik-Butler, celikbutler@ieee.org
Trapping Parameters Through RTS in MOSFETs Noise and Reliability Laboratories, Zeynep Celik-Butler, celikbutler@ieee.org
Effects of Quantization • Increase in effective energy band-gap: change in te and tc • Shift in carrier distribution: change in Cox Noise and Reliability Laboratories, Zeynep Celik-Butler, celikbutler@ieee.org
3-D Treatment of RTS Noise and Reliability Laboratories, Zeynep Celik-Butler, celikbutler@ieee.org
2-D Treatment of RTS - tc and te Noise and Reliability Laboratories, Zeynep Celik-Butler, celikbutler@ieee.org
2-D Treatment of RTS • From Stern - Howard wave-function: Noise and Reliability Laboratories, Zeynep Celik-Butler, celikbutler@ieee.org
2-D Treatment of RTS • Calculate the inversion carrier concentration assuming they are located primarily at E0: Noise and Reliability Laboratories, Zeynep Celik-Butler, celikbutler@ieee.org
2-D Treatment of RTS - tc and te • To first order, the ratio is not affected by quantization. Noise and Reliability Laboratories, Zeynep Celik-Butler, celikbutler@ieee.org
RTS Measurements • MDD n-MOSFETs • Weff Leff = 1.37 0.17 mm2 • Tox = 4 nm • VT = 0.375 V for VSB = 0 V • strong inversion, linear region VDS = 100 mV • VSB = 0 - 0.4 V, VGS = 0.5 - 0.75 V Noise and Reliability Laboratories, Zeynep Celik-Butler, celikbutler@ieee.org
ECox-ET and zT from tc and te VSB=0 V ln(tc/te) Noise and Reliability Laboratories, Zeynep Celik-Butler, celikbutler@ieee.org
ECox-ET and zT from tc and te VSB=0.4 V ln(tc/te) Noise and Reliability Laboratories, Zeynep Celik-Butler, celikbutler@ieee.org
ECox-ET and zT from tc and te Tox =4 nm Noise and Reliability Laboratories, Zeynep Celik-Butler, celikbutler@ieee.org
Dependence ofte on VSB VGS=0.75 V te (s) VGS=0.55 V Noise and Reliability Laboratories, Zeynep Celik-Butler, celikbutler@ieee.org
Dependence oftc on VSB VGS=0.55 V VGS=0.65 V tc (s) VGS=0.75 V Noise and Reliability Laboratories, Zeynep Celik-Butler, celikbutler@ieee.org
cn Extracted from tc and te Noise and Reliability Laboratories, Zeynep Celik-Butler, celikbutler@ieee.org
2-D Treatment of RTS - Amplitude • Question: How does quantization affect number and mobility fluctuations? • Number fluctuation through N • Mobility fluctuations through oxide charge scattering, mt. Noise and Reliability Laboratories, Zeynep Celik-Butler, celikbutler@ieee.org
Extraction of Scattering Coefficient • Mobility Fluctuations: • Using Surya’s 2D surface mobility fluctuations model, Noise and Reliability Laboratories, Zeynep Celik-Butler, celikbutler@ieee.org
Calculation of Scattering Coefficient • Considering a single trap: Nt(E,z) = Ntd(E-ET) d(z-zT) a Noise and Reliability Laboratories, Zeynep Celik-Butler, celikbutler@ieee.org
RTS Amplitude Noise and Reliability Laboratories, Zeynep Celik-Butler, celikbutler@ieee.org
Extraction of Scattering Coefficient Tox =4 nm a = 2.91x10⁻¹³ - 9.93x10⁻¹⁵ ln(N) Noise and Reliability Laboratories, Zeynep Celik-Butler, celikbutler@ieee.org
Extraction of Scattering Coefficient Tox =8.6 nm W L = 1.2 0.35 mm2 zT =0.25 nm Noise and Reliability Laboratories, Zeynep Celik-Butler, celikbutler@ieee.org
Possible Reasons for Discrepancy • Threshold non-uniformity along the channel is not taken into account. • Location of the trap along the channel • Variation of the channel voltage from source to drain is neglected. • dDN/dDNt 1 is not valid, even in strong inversion, for very thin oxides. Noise and Reliability Laboratories, Zeynep Celik-Butler, celikbutler@ieee.org
ACKNOWLEDGEMENTS • This work has been supported by NSF, THECB-ATP, SRC, TI, Legerity, Motorola and ST-Microelectronics. Noise and Reliability Laboratories, Zeynep Celik-Butler, celikbutler@ieee.org