Download
1 / 6
60 likes | 204 Views
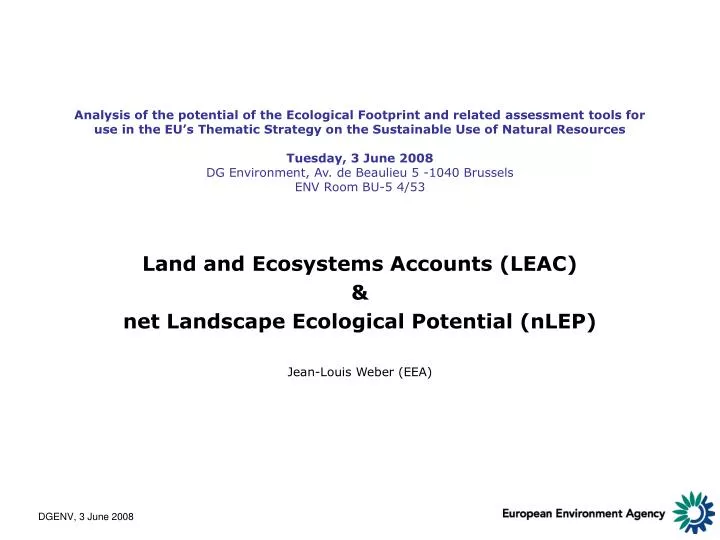
Analysis of the potential of the Ecological Footprint and related assessment tools for use in the EU’s Thematic Strategy on the Sustainable Use of Natural Resources Tuesday, 3 June 2008 DG Environment, Av. de Beaulieu 5 -1040 Brussels ENV Room BU-5 4/53. Land and Ecosystems Accounts (LEAC) &

E N D
Analysis of the potential of the Ecological Footprint and related assessment tools for use in the EU’s Thematic Strategy on the Sustainable Use of Natural ResourcesTuesday, 3 June 2008DG Environment, Av. de Beaulieu 5 -1040 Brussels ENV Room BU-5 4/53 Land and Ecosystems Accounts (LEAC) & net Landscape Ecological Potential (nLEP) Jean-Louis Weber (EEA)
The questions behind ecosystem accounting • Risks of unsustainable use of the living natural capital are ignored: the negative impacts of over-harvesting, force-feeding with fertilisers, intoxication, introduction of species, fragmentation by roads, or sealing of soil by urban development have no direct monetary counterpart. • The natural capital is not even amortised in accounting books of companies and in the national accounts – no allowance is made for maintaining ecosystems’ critical functions and services. The full cost of the domestic products is not covered in many cases by their price. • This is as well the case of the price of imported products made from degraded ecosystems: their full cost is not covered by their price. • Actual value for people of free ecosystem services is not accounted (the market tells: price is zero).
Aggregates: integrated indicators valid at multiple scales This is not only a scientific, technical or data issue but a governance issue • Action scale: local communities, conservations agencies, companies, citizens – management, development, production, consumption, mitigation • Government scale: regions, countries (Unions of…) – framing and implementing policies, tradeoffs, monitoring • Global scale: global market and global ecosystem (atmosphere, oceans, biodiversity, river catchments…) – common objectives, conventions, monitoring, global mitigation • Some indicators are scale-specific, other indicators are valid at multiple scales: ecological potential, HANPP, virtual land, cost of maintenance and restoration of ecosystems net Landscape Ecological Potential (nLEP): a multi-scale indicator developed by the EEA from LEAC
The making of nLEP Corine land cover (derived from satellite images) Green Background Landscape Index (derived from CLC) Naturilis (derived from Natura2000 & CDDA) Effective Mesh Size (MEFF, derived from TeleAtlas and CLC) net Landscape Ecological Potential (nLEP) 2000, by 1km² grid cell nLEP 2000 by NUTS 2/3
1990 2000 Change 1990-2000 Measuring change: LEAC/nLEP 1990-2000 • Change in Ecological Potential of SES Wetlands, ES,FR, IT, GR – 10 km strip