Download
1 / 16
160 likes | 293 Views
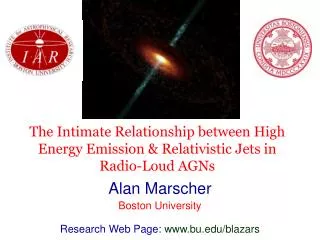
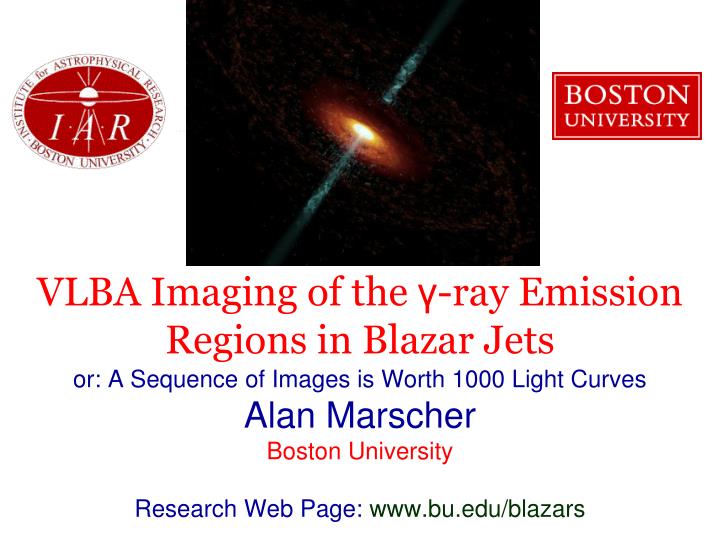
VLBA Imaging of the γ -ray Emission Regions in Blazar Jets. or: A Sequence of Images is Worth 1000 Light Curves Alan Marscher Boston University Research Web Page: www.bu.edu/blazars. Main Collaborators in the Study. Svetlana Jorstad, Iván Agudo, & M. Joshi (Boston University)

E N D
VLBA Imaging of the γ-ray Emission Regions in Blazar Jets or: A Sequence of Images is Worth 1000 Light Curves Alan Marscher Boston University Research Web Page:www.bu.edu/blazars
Main Collaborators in the Study Svetlana Jorstad, Iván Agudo, & M. Joshi (Boston University) Valeri Larionov (St. Petersburg State U., Russia) Margo & Hugh Aller (U. Michigan) Paul Smith (Steward Obs.) Anne Lähteenmäki (Metsähovi Radio Obs.) Mark Gurwell (CfA) Ann Wehrle (SSI) Paul Smith (Steward) Thomas Krichbaum (MPIfR) + many others Telescopes: VLBA, GMVA, EVLA, Fermi, RXTE, Swift, Herschel, IRAM, UMRAO, Lowell Obs., Crimean Astrophys. Obs., St. Petersburg U., Pulkovo Obs., Abastumani Obs., Calar Alto Obs., Steward Obs., + many others Funded by NASA & NSF
Diagram of a Quasar Gamma-ray emission might occur inside BLR, in 7 mm core, or elsewhere along the jet via scattering of different sources of seed photons by relativistic electrons in the jet
Method for Locating High-frequency Emission • mm-wave VLBI imaging to follow changes in jet, especially motions of superluminal knots • Associate optical, X-ray, or -ray flares with superluminal knot if flare is coincident with passage of knot through 43 GHz “core” (which is parsecs downstream of black hole) • Measure optical polarization position angle during flare & match with VLBI feature with similar value of • Determine location of X-ray & gamma-ray emission sites by time lag of high-E variations relative to changes in optical & mm-wave flux or when knot is in core
Quasar PKS 1510-089 (z=0.361) in 2009 Multiwaveband monitoring: General (but not one-to-one) correspondence between -ray & optical 37 GHz flux starts rising at same time as start of -ray/optical outburst VLBA images at 43 GHz Color: linearly polarized intenisty Contours: total intensity Bright superluminal knot passed “core” at time of extreme optical/-ray flare Apparent speed = 21c Time when knot passes through core Marscher et al. (2010, Astrophysical Journal Letters, 710, L126) 2009.0 2009.6
Rotation of Optical Polarization in PKS 1510-089 Rotation starts when major optical activity begins, ends when major optical activity ends & centroid of superluminal blob passes through core • - After rotation, optical pol. angle ~ same as that of superluminal knot • Also, later polarization rotation similar to end of earlier rotation, as expected if caused by geometry of B; event occurs as a weaker blob approaches core Model curve: blob following a spiral path in an accelerating flow increases from 8 to 24, from 15 to 38 Blob moves 0.3 pc/day as it nears core Core lies > 17 pc from central engine 2009.0 2009.6
Sites of -ray Flares in PKS 1510-089 Interpretation: All flares in early 2009 caused by a single superluminal knot moving down jet Sharp flares occur as knot passes regions of high photon density or standing shocks that compress the flow or energize high-E electrons Standing shock system, “core” Broad-line clouds Knot Sites of high optical/IR emission in relatively slow sheath of jet
3C 279 in 2008-09 1. Multi-flare outburst in -ray, optical, & X-ray after new superluminal knot appears Flux 2. X-ray dominant flare, peak after new knot appears 3. Simultaneous -ray, optical, & X-ray flare near time when superluminal knot appears knot
3C 454.3: 2010 super-outburst Knot ejected in late 2009, vapp = 10c RJD=5502, 1 Nov 2010; core: 10.3 Jy RJD=5507, 6 Nov 2010; core: 14.1 Jy RJD=5513, 12 Nov 2010; core: 14.2 Jy RJD=5535, 4 Dec 2010; core: 17.7 Jy
OJ287 (Agudo et al. 2011, ApJL, 726, L13) Change in jet direction starting ~ 2005 Core is the more southern compact feature, C0 High-E flare near start of mm-wave flux outburst & ~ coincident with max. in polarization of feature C1, which moves very slowly Flare B appear to occur as superluminal knot passes through C1
Implications • Many gamma-ray flares in blazars occur in superluminal knots that move down the jet & are seen in VLBA images • Sometimes upstream of 43 GHz core • Often in or downstream of 43 GHz core • Intra-day γ-ray/optical variability can occur in mm-wave regions • The highest-Γ jets are very narrow, < 1°, so at 10 pc from the central engine, jet < 6 lt-months across • Doppler factors can be very high, >50 (Jorstad et al. 2005) • Volume filling factor of γ-ray/optical emission << 1 if very high-energy electrons are difficult to accelerate (as in turbulent jet model of Marscher & Jorstad 2010) • Rotations of polarization & timing of flares agree with magnetic-launching models of jets, where jet flow accelerates over long distances
Advantage of Wider Bandwidth/Higher Recording Rate Mkn 421 1 Aug 2010 Currently: • High dynamic range (> 100:1) at 43 GHz if core flux > ~0.5 Jy • Low sensitivity/dynamic range at 86 GHz • Cannot image knots in key TeV blazars such as Mkn 421 with high enough fidelity to measure motion With upgrade (this year!): Bandwidth for routine observations ~ 4 times broader • High sensitivity higher dynamic range 24 Oct 2010 4 Dec 2010
Emission feature following spiral path down jet Emission feature following spiral path down jet - rotationn of EVPA Feature covers much of jet cross-section, but not all Centroid is off-center Net B rotates as feature moves down jet, P perpendicular to B 1 3 Bnet P vector 2 4