Download
1 / 41
420 likes | 535 Views
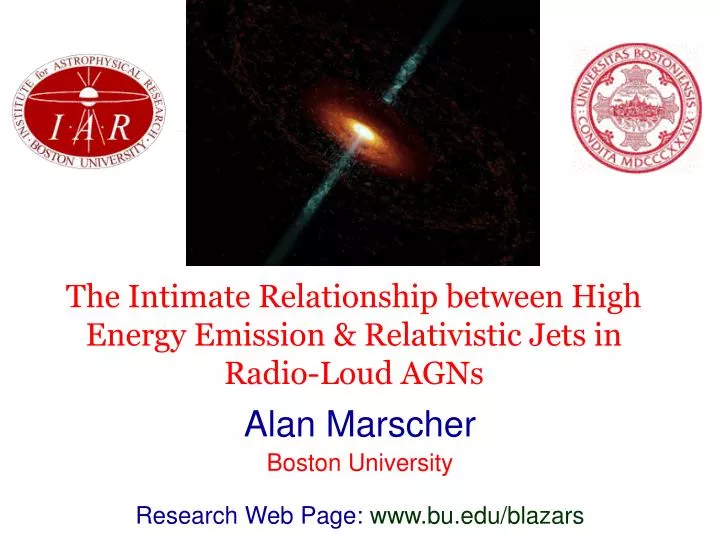
The Intimate Relationship between High Energy Emission & Relativistic Jets in Radio-Loud AGNs. Alan Marscher Boston University Research Web Page: www.bu.edu/blazars. Main Collaborators. Svetlana Jorstad (Boston University) Margo Aller (University of Michigan)

E N D
The Intimate Relationship between High Energy Emission & Relativistic Jets in Radio-Loud AGNs Alan Marscher Boston University Research Web Page:www.bu.edu/blazars
Main Collaborators Svetlana Jorstad (Boston University) Margo Aller (University of Michigan) Ian McHardy (University of Southampton, UK) Thomas Balonek (Colgate University) Josè Luis Gómez (Instituto de Astrofísica de Andalucia) H. R. Miller, Kevin Marshall, John McFarland (Georgia St. Univ.) Massimo Villata & Claudia Raiteri (Torino Observatory, Italy) Gino Tosti (University of Perugia Observatory, Italy) Valeri Larionov (St. Petersburg State University, Russia) Omar Kurtanidze (Abastumani Observatory, Rep. of Georgia) A. Lähteenmäki, M. Tornikoski, H. Teräsranta (Metsähovi Radio Observatory, Finland) Martin Gaskell, Elizabeth Klimer (University of Nebraska) Ian Robson (U. Central Lancashire) Andrei Sokolov (Boston U. → U. Central Lancashire, UK) Funded by NASA & NSF
Emission Regions in an AGN → Unbeamed optical/uv/X-ray emission from accretion disk + corona → Unbeamed broad & “narrow” optical emission lines from clouds → Optical absorption lines from outflows (funnel-shaped?) → Radio core & jet emission lie outside broad emission-line region → Beamed X-rays & gamma-rays come from jet Unbeamed Beamed
Some Questions on the Nature of AGNsthat can be addressed by multi-waveband variability & VLBI Observational • How are high-frequencyevents related to superluminal radio knots? • Where does the higher frequency emission occur relative to the radio jet imaged by mm-wave VLBI? • Is there a relation between emission from the central engine & events seen in the jets? Theoretical • How are jets made by accreting black holes? • Where & how are jets accelerated to high s? • How/where are jets focused into narrow cones? • Where & how are relativistic electrons accelerated? • What is the physics of the jet flow (shocks, turbulence, interaction with gas, matter content, instabilities, magnetic field pattern, bending, precession)?
Multi-waveband Toolsfor Addressing Questions 1. Variability (good for all wavebands) • Related to size of emission region • Cross-frequency time lags help to locate sites of emission
Multi-waveband Toolsfor Addressing Questions 2. Radio/mm-wave imaging: great resolution • Picture of the jet (with polarization) • Multi-epoch images allow us to watch variations
Multi-waveband Toolsfor Addressing Questions 3. Polarization • Probes direction & degree of order of magnetic field
Limitations of Tools • Timescale of variability is related to size but does not give location relative to central engine or core of jet • Opacity (even at 7 mm wavelength) & resolution limit how close to the central engine VLBI images can explore
Overcoming Limitations: Combine tools • Variability of SED (can separate variable & non-variable components) • Variability & VLBI (can see what’s changing directly or see the effects of variations when the disturbance propagates downstream) • Multi-waveband polarization (can use polarization signatures to identify high-frequency features on VLBI images)
Evidence that High & Low- Nonthermal Emission is Related:Correlated Light Curves & Polarization Properties
The Quasar PKS 1510-089 (z=0.361)Radio/X-ray Correlation Arrows: Times of superluminal ejections at 43 GHz (Optical not well sampled)
The Quasar PKS 1510-089 (cont.) X-ray variations correlated with high- radio, with radio variations leading X-ray by an average of 6 days > 0: Radio Leads X-rays originate from radio-emitting part of the jet Flares occur as superluminal knots emerge from the core
The Quasar 3C 279 (z=0.538) Extreme variations in flux at optical & X-ray (& γ-ray) Variations in X-ray flux usually well-correlated with changes in optical brightness . . . but there is not a one-to-one correspondence on time scales of days X-ray Optical Radio
The Quasar 3C 279 (cont.) Variations in X-ray flux usually well-correlated with changes in optical brightness → time lag of 15±15 days, with optical leading Discrete Cross-Correlation Coefficient (X-ray vs. optical) X-ray/8 mm correlation also quite strong, with radio lagging by 14040 days Either: X-ray/optical emission comes from ~ 40 pc upstream of core of jet or: X-ray/optical emission comes from core &flux of knot peaks 140 days (~0.2 mas) after it leaves core (in favor: superluminal ejections tend to occur near beginning of X-ray flares; against: flux of many knots already decreasing by 0.15 mas from core) Positive delay: optical leads
BL Lac (z=0.069) Usually, X-ray continuum spectrum is too flat to be continuation of synchrotron spectrum Probably synchrotron self-Compton X-ray Strong X-ray/optical correlation of long-term light curve with ~ zero lag [Correlation not so good on short timescales (Böttcher et al. 2003)] Period of strongest activity corresponds to steep X-ray spectral index probably high-E tail of synchrotron emission Superluminal ejection occurred during period of strongest activity X-ray spectral index Optical
Why Not One-to-One Correspondence between Radio or Optical/IR & X-ray? SSC: All synchrotron photons that are in the right frequency range to scatter up to a given X-ray energy will contribute equally to the SSC X-ray/γ-ray flux → Relationship between SSC X-ray/γ-ray & synchrotron emission at any given frequency is simple only if source is uniform → Frequency-dependent time delays result from(1) light-travel delays (Sokolov & Marscher 2004)(2) frequency stratification (e.g., Marscher & Gear 1985): e-s accelerated at shock front, highest-E e-s “die” quickly, lower-E ones live longer lower ’s emitted over larger volume McHardy et al. 1999 MNRAS
How about TeV Blazars? Thus far, it appears that the radio jets of TeV blazars are rather slow & not highly variable on parsec scales(Marscher 1999, Astroparticle Phys.; Piner 2003 , ApJ) Maybe they are e--e+ jets with flat electron energy distributions such that the jet loses momentum & decelerates as the electrons cool
Purple: optical pol. Green: ~ 1 mm pol. Correlated Multiwaveband Polarization →suggests that mm-wave core region = site of optical emission Blazars: optical & mm-wave linear polarization often has similar E-vector direction (see also Gabuzda & Sitko 1994) Degree of optical polarization is often higher Lister & Smith (2000): quasars with low optical polarization also have low core polarization at 43 GHz
Identifying Knots by PolarizationMany superluminal knots have stable electric vector position angles (EVPAs) of linear polarization Might be able to identify knots responsible for optical/near-IR variations by similar EVPA as knots on VLBA images Scale: 1 mas = 4.8 pc = 16 lt-yr (Ho=70)
High γ-Ray Flux Tends to Occur after Ejections of Superluminal Radio Knots (Jorstad et al. 2001 ApJ) 23/28 γ-ray flares are contemporaneous with our VLBA data 11 superluminal jet components are associated with γ-ray flares(≤6 expected by chance) Example: 3C 273
Increase in polarized radio flux accompanies high γ-ray flux + ejection of superluminal knot (Jorstad et al. 2001 ApJ) Example: 3C 273
Proposed Method for Identifying Jet Features Responsible for High-frequency Variations Look for correlated polarization variability in optical, IR, submm, & mm-wave Objective: Locate sites of variable high-frequency emission on mm-wave VLBA images → relate optical/near-IR light curves to images Relate to X-ray & -ray by correlating light curves (RXTE, Swift, AGILE, GLAST) with optical/near-IR, & mm-wave light curves
Observational Connection between Jet & Accretion Disk Microquasars: Change in X-ray state precedes appearance of knots in radio jet (Mirabel et al., Fender et al.) → Might expect something similar in AGNs Need AGNs with blazar-like jets in radio but main X-ray component from accretion disk/corona → Blazar-like radio galaxies are good candidates
The FR I Radio Galaxy 3C 120 (z=0.033) Sequence of VLBA images (Marscher et al. 2002) Scale: 1 mas = 0.64 pc = 2.1 lt-yr (Ho=70) HST image (Harris & Cheung) • Superluminal apparent motion, 4-6c (1.8-2.8 milliarcsec/yr) • X-ray spectrum similar to BH binaries & Seyferts • Mass of central black hole ~ 3x10⁷ solar masses (Marshall, Miller, & Marscher 2004; Wandel et al. 1999)
Superluminal Ejections in 2002-04 Sequence of VLBA images Scale: 1 mas = 0.64 pc = 2.1 lt-yr (Ho=70) 5 bright superluminal knots, apparent motion = 4.5-5c All other knots are less than 10% of core brightness beyond 0.5 milliarcsec from core
X-Ray Dips in 3C 120 60 days Superluminal ejections follow X-ray dips Similar to microquasar GRS 1915+105 Radio core must lie at least 1 lt-yr from black hole to produce the observed X-ray dip/superluminal ejection delay of ~ 60 days
3C 120 Movie (by J.L. Gómez) Red ellipse: inner accretion disk Contours: 43 GHz intensity Inset: X-ray light curve
FR II Radio Galaxy 3C 111 (z=0.0485) Seems to Do the Same Similar to 3C 120 in radio & X-ray 5c (1.5 milliarcsec/yr) Scale: 1 mas = 0.92 pc = 3.0 lt-yr (Ho=70) May 2004 July 2004
X-Ray Light Curve of 3C 273: 2001-2005(A quasi-blazar, or “quasar”) Somewhat similar to 3C 120; we will see whether X-ray dips are followed by superluminal ejections. We need first to separate jet & central engine X-rays Thus far, we see no signs of correlation between radio/mm and X-rays Previously, McHardy et al. found good K-band/X-ray correlation with ~ 1 day time delay, X-ray lagging IR
Evidence for Collimation of Jets Well Outside Central Engine • VLBA observations of M87: jet appears broad near core • → Flow may be collimated on scales ~1000 Rs Junor et al. 2000 Nature
Cygnus A (Bach et al. 2004, 2005)FR II radio galaxy, jet at large angle to l.o.s. Counter-core Core Gap between core & counterjet < 0.7 mas Apparent speed increases with distance from core
Intrinsic Half Opening Angles of Jets(Jorstad et al. 2005, AJ, submitted) • 1/ Agrees with models in which jet is focused as it is accelerated over an extended region.(HD: Marscher 1980; MHD: Vlahakis & Königl 2004)
Jet Acceleration over Extended Region Theory: A jet with > ~10 cannot propagate out of nuclear region (Phinney 1987) HD: Pressure gradient p r-aLorentz factor increases with cross-sectional radius R: Γ R p-1/4 ra/4 If a < 4/(3+1) and viewing angle is small, brightest emission is where Γ reaches its asymptotic value If viewing angle is large, brightest emission is at lowest r where high-E electrons are accelerated (Marscher 1980 ApJ) MHD: Models still being developed Vlahakis & Königl (2004, ApJ) solution appears similar to HD solution, except that Γ decreases away from jet axis & there is no distinct boundary In either case, energy density at base of jet must exceed Γρc2 Might require a magnetosphere (pulsar or ergosphere of spinning BH)
Conclusions Combining multi-waveband techniques is a powerful – but painful! - way to explore the most interesting physics of AGNs. The effectiveness is limited mainly by the amount of telescope time + astronomers’ time available Thus far, each source behaves differently → we need to follow more objects with even better time coverage to probe the jet and its relation to the central engine properly In PKS 1510-089 the X-rays come from the radio-emitting section of the jet; the same seems to be true for gamma-rays from most EGRET sources. In 3C 279 the X-rays (& gamma-rays) come from the optically emitting region, which seems to lie well upstream of the VLBI core of the jet. The core in the blazar-like radio galaxies 3C 120 & 3C 111 lies > 0.4-1 pc from the central engine; drops in X-ray flux occur as disturbances shoot down the jet We need better radio, IR, & optical monitoring to take full advantage of AGILE, GLAST, VERITAS et al. (Cherenkov telescopes), & other monitoring instruments
End of Talk Remaining slides are to be shown only if they will be useful for discussion after the talk
Sketch of 3C 120 Nucleus X-rays mainly from corona/wind, some might be from jet as well Popular model: jet propelled by twisted poloidal magnetic field emanating from disk or ergosphere Eikenberry & van Putin (2003), Livio et al. (2003), Tagger et al. (2004): More efficient outflow into jet when turbulent field becomes more poloidal → Gas in disk falls into BH more quickly, more advective, radiates less (dip)
Comparison of GRS1915+105 with 3C 120 Light Curves BH mass of 3C 120 ~2x10⁶ times that of GRS 1915+105, so timescales of hours to months in the former are similar to the scaled-up quasi-periods (0.15 to 10 s) & duration of X-ray dips in the latter. Typical fractional amplitude of dips is also similar Long, deep dips not yet seen in 3C 120 blow-up ← GRS 1915+105 over 3000 s on 9/9/97 Light curve (top) & PSD (bottom) (Taken from Markwardt et al. 1999 ApJL)
Mirabel & Rodriguez (1994 Nature) The “Microquasar” GRS 1915+105: A Faster-than-light Object in Our Galaxy Apparent velocity 2-3c, but jet makes a large angle to line of sight Γ~5 (Fender et al. 1999) Binary system, giant star + black hole of 14 solar masses Ejection of superluminal knots follows end of low, hard X-ray state 3 different types of behavior (Belloni et al. 2000)
Evidence for Acceleration of Jet on Parsec Scales Acceleration of proper motion near core in some jets A jet with > ~10 cannot propagate out of nuclear region (Phinney 1987) How then can we have jets with observed apparent motions > 25c, implying > 25 and focusing to within 0.5 degrees or less? → Models in which jet accelerates & collimates out to pc-scale radio core (Marscher 1980, ApJ; Vlahakis & Konigl 2004, ApJ) Accelerating Jet
The Radio Galaxy NGC1052 (z=0.0049) M. Kadler et al. (2004) Apparent speed of radio knots ~ 0.25c Iron line at 6.4 keV had more pronounced “red” wing prior to radio ejection event than at two other epochs 3C 120 ASCA spectrum (Grandi et al. 1997) A major radio ejection event may be preceded by enhanced inflow in the relativistic region near the black hole in NGC1052 The iron line in 3C 120 is probably variable based on widely diverse reports of equivalent width; we are analyzing our RXTE observations in an effort to measure variability of the line & search for occasional broad wing
BL Lac (z=0.069) Jet does a hula dance: ~ 2-yr cycle of 24° swing in direction of jet near core Scale: 1 mas = 1.3 pc = 4.1 lt-yr (Ho=70)