Download
1 / 23
230 likes | 322 Views
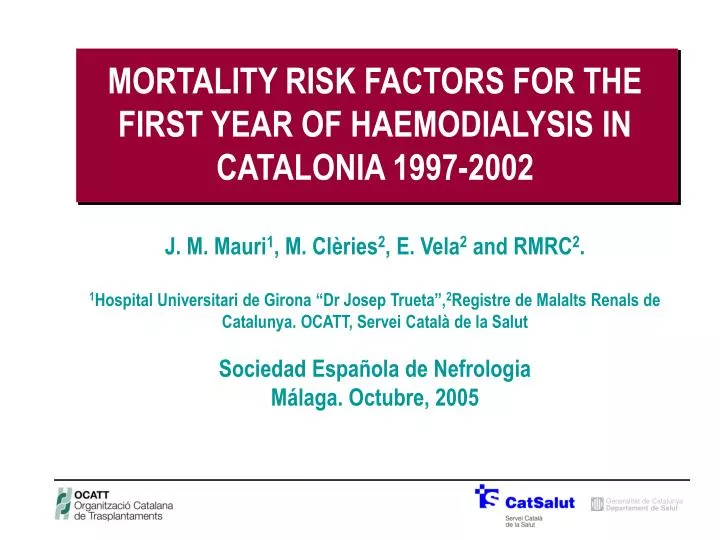
MORTALITY RISK FACTORS FOR THE FIRST YEAR OF HAEMODIALYSIS IN CATALONIA 1997-2002 J. M. Mauri 1 , M. Clèries 2 , E. Vela 2 and RMRC 2 . 1 Hospital Universitari de Girona “Dr Josep Trueta”, 2 Registre de Malalts Renals de Catalunya. OCATT, Servei Català de la Salut

E N D
MORTALITY RISK FACTORS FOR THE FIRST YEAR OF HAEMODIALYSIS IN CATALONIA 1997-2002 J. M. Mauri1, M. Clèries2, E. Vela2 and RMRC2. 1Hospital Universitari de Girona “Dr Josep Trueta”,2Registre de Malalts Renals de Catalunya. OCATT, Servei Català de la Salut Sociedad Española de Nefrologia Málaga. Octubre, 2005
Mortality indicators: international comparison (2) 21,1 USRDS-(2001) 13,6 Australia (ANZDATA)- (2002) 14,25 Italy (Soc. Nefrol)-(2002) 16,2 RMRC (1997-2002) HD DM USRDS-(2001) 25,1 Australia (ANZDATA)- (2002) 17,7 UK- (1997-2001) 18,5 RMRC (1997-2002) 21,3 0 5 10 15 20 25 30 mortality per 100 patients/year
Objective To analyze the risk factors related to early mortality (90 days), and the mortality at 6 months and in the first year after starting haemodialysis, on the patients entered in the period 1997-2002 .
Methods (1) • Data Source: Catalan Renal Registry (RMRC).Health Department of the Government of Catalonia • • The RMRC was created in 1984 • • Declaration is obligated for all patients admitted on RRT in Catalonia • • On time up-date for changing modality of RRT and mortality, and • Annual up-date for morbidity, mortality, vascular access and the usual those clinical and biological parameters.
Methods (2) Patients: • All patients older than 14 who initiated HD in Catalonia on the 1997-2002 period (n=4,704). • Information about all variables was available for 4,579 (97.3% of all patients)
Risk Factors studied: Age Sex Primary renal diseaseCardiac diseases Stroke Arrythmia Peripheral vascular diseases Malignancies Liver Chronic diesasesOPD Tuberculosis Infection Arthropaty Gut diseases Esoph., stomach& duod.Presentation of ESRD1st Vascular accessFunctional autonomy degree Methods (3)
Methods (4) Statistics: •c2 for comparison of proportions. •Logistic Regression to identify the risk factors associated to early death (90 days, 6 moths & 1 year). Signification was adjusted for p<0.05. An examination of all possible two-way interactions are tested. Calibration was assessed using Hosmer-Lemeshow goodness-of-fit test and discrimination using the area under the receiver operating characteristics (ROC) curve.
Mortality rates and Standard Mortaliy Index (SMI) on the first year of HD after age group SMI Rates per 1,000 400 100 350 80 300 250 60 . 200 . 40 150 . . 100 20 . 50 . . . . 0 0 20-24 25-34 35-44 45-54 55-64 65-74 75-84 >84 GLOBAL 20-24 25-34 35-44 45-54 55-64 65-74 75-84 >84 GLOBAL Age group Age group . Catalonia 2000 HD 97-02 IC 95% IME Referred to the Catalan Population 2000
Causes of Death after Age Group. Mortality per 100 patients / year 14 12 10 8 6 4 2 0 20-24 25-29 30-34 35-39 40-44 45-49 50-54 55-59 60-64 65-69 70-74 75-79 80-84 >84 Age at HD start Cardiovascular Infection Cancer
Adjusted (*) Odds Ratios for Age (10 years). 2 . . . 0,2 OR at 90 days OR at 6th months OR at 1 year
CRF Presentation at HD start after Age Group and adjusted (*) Odds Ratio 2 . . . . . . 0,2 Unknown Unknown Unknown Descompensation Descompensation Descompensation OR at 90 days OR at 6 months OR at 1st year (*)Adjusted for Age, Gender, Functional Autonomy Degree, Associate Morbidities, CRF Presentation and first choice Vascular Access.
OCPD at HD start after Age Group and adjusted (*)Odds Ratio 2 . . . 0,2 OR at 90 days OR at 6th month OR at 1st year (*)Adjusted for Age, Gender, Functional Autonomy Degree, Associate Morbidities, CRF Presentation and first choice Vascular Access.
Malignancies at HD start after Age Group and adjusted (*)Odds Ratio . 2 . . 0,2 OR at 90 days OR at 6th month OR at 1st year (*)Adjusted for Age, Gender, Functional Autonomy Degree, Associate Morbidities, CRF Presentation and first choice Vascular Access.
Chronic liver dis. at HD start after Age Group and adjusted (*)Odds Ratio 2 . . . 0,2 OR at 90 days OR at 6th month OR at 1st year (*)Adjusted for Age, Gender, Functional Autonomy Degree, Associate Morbidities, CRF Presentation and first choice Vascular Access.
PRD at HD Start after Age Group and adjusted (*) Odds Ratios. Percentage 30 25 20 15 10 5 0 <25 25-29 30-34 35-39 40-44 45-49 50-54 55-59 60-64 65-69 70-74 75-79 80-84 >84 Age at start of HD Diabetes Systemic dis. . 2 . . . . . 0,2 DN Systemic D. DN Systemic D. DN Systemic D. OR at 90 Days OR at 6 Months OR at 1 Year (*)Adjusted for Age, Gender, Functional Autonomy Degree, Associate Morbidities, CRF Presentation and first choice Vascular Access.
Ischaemic Cardiopathy at the HD start after age group, and adjusted (*) Odds Ratios. 2 . . . 0,2 OR at 90 days OR at 6th month OR at 1st year (*)Adjusted for Age, Gender, Functional Autonomy Degree, Associate Morbidities, CRF Presentation and first choice Vascular Access.
Arrythmia at HD start after Age Group and adjusted (*)Odds Ratio 2 . . . 0,2 OR at 90 days OR at 6th month OR at 1st year (*)Adjusted for Age, Gender, Functional Autonomy Degree, Associate Morbidities, CRF Presentation and first choice Vascular Access.
Functional Autonomy Degree at HD start after Age Group and adjusted (*) Odds Ratio 10 . . . . . . 1 0,1 Limited Special care Limited Special care Limited Special care OR at 90 days OR at 6 months OR at 1st year (*)Adjusted for Age, Gender, Functional Autonomy Degree, Associate Morbidities, CRF Presentation and first choice Vascular Access.
Catheter as a first VA at HD start after Age group and adjusted (*) Odds Ratio . . . 2 0,2 OR at 90 days OR at 6th month OR at 1st year (*)Adjusted for Age, Gender, Functional Autonomy Degree, Associate Morbidities, CRF Presentation and first choice Vascular Access.
Predictive models at 90 days, 6 months and 1 year Mathematical Model: π(x)= eβo+β1x 1+ eβo+β1x β: 90 days 6 months 1st year Sex (female) - 0.179 - 0.160 - 0.082 Age 0.360 0.288 0.306 PRD: diabetes 0.179 0.260 0.244 systemic 0.654 0.600 0.671 Funct. autonomy degree: limited 0.758 0.808 0.612 special care 1.285 1.209 1.227 Ischaemic heart dis. 0.108 0.231 0.366 Cardiomyopathy 0.329 0.288 0.203 Arrythmia 0.441 0.380 0.371 OCPD 0.261 0.267 0.345 Malignancies 0.454 0.311 0.631 Chronic liver disease 0.203 0.351 0.377 CRF Presentation: unknown 0.351 0.480 0.334 descompensation 0.088 0.121 0.071 Catheter 0.090 0.863 0.759 β0 - 7,266 - 5.880 - 5.167
Exemples Man, 49 with Standard PRD, normal FAD, normal CRF Presentation and with associated Ischaemic heart disease. Man, 69 with Standard PRD, Descompensated CRF and limited FAD, and with Ischaemic heart disease.
Conclusions • Early mortality correlated with age, systemic PRD, arrythmia and OCPD • A strong correlation was found for patients starting HD with cardiovascular disease, catheter as first vascular access or suffering from a low functional autonomic level. • At six months Diabetes (both as PRD or co-morbidity) and late referral were found significant. • At one year, diabetes (both as PRD or comorbidity), ischaemic heart disease, arythmia and malignances attained signification. • A model-based predictive model may be suggested. • Further analysis are required to validate the model and to identify the correspondence degrees between either individual or associate morbid conditions as seen at the HD start and the cause of the death.