Download
1 / 79
850 likes | 1.18k Views
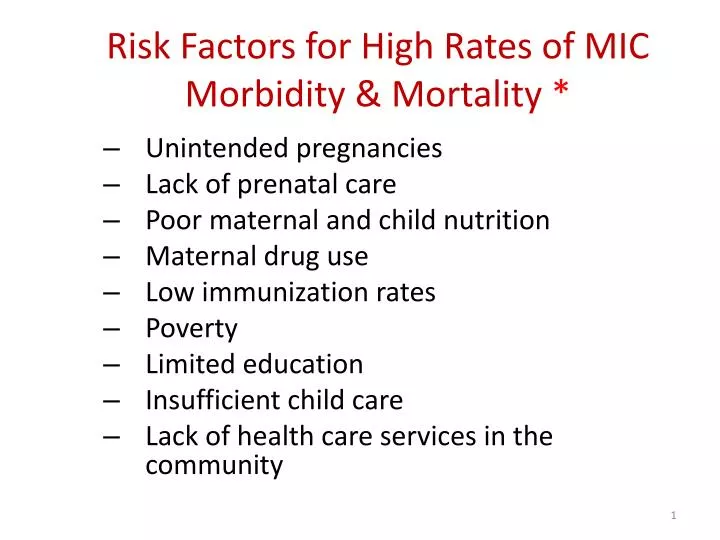
Risk Factors for High Rates of MIC Morbidity & Mortality *. Unintended pregnancies Lack of prenatal care Poor maternal and child nutrition Maternal drug use Low immunization rates Poverty Limited education Insufficient child care Lack of health care services in the community.

E N D
Risk Factors for High Rates of MIC Morbidity & Mortality * • Unintended pregnancies • Lack of prenatal care • Poor maternal and child nutrition • Maternal drug use • Low immunization rates • Poverty • Limited education • Insufficient child care • Lack of health care services in the community
Teenage Births * • Teenagers who become pregnant and have a child are more likely than their peers who are not mothers to: • Drop out of school • Not get married or have a marriage end in divorce • Rely on public assistance • Live in poverty
Maternal Health & Mortality * • Maternal health: the health of women in the childbearing years, including those in the pre-pregnancy period, those who are pregnant, and those who are caring for young children • Maternal mortality: the death of a woman while pregnant or within 42 days of termination of pregnancy, irrespective of the duration and site of the pregnancy, from any cause related to or aggravated by the pregnancy or its management but not from accidental or incidental causes • Rate is number of mothers dying per 100,000 live births
Infant Mortality * • Is the death of a child younger than 1 year • Infant death is an important measure of a nation’s health because it is associated with a variety of risk factors including: • Maternal health • Quality of access to medical care • Socioeconomic conditions • Public health practices
Infant Mortality • Leading Causes * • Congenital abnormalities • Preterm/low birth weight • Sudden infant death syndrome (SIDS) • Problems related to complications of pregnancy • Respiratory distress syndrome
Improving Infant Health • Improving Health * • Reducing premature births, which are babies born prior to 37 weeks’ gestation • Reducing low birth weight, which are infants that weigh 5.5 pounds or less at birth • Reducing smoking during pregnancy • Eliminating heavy maternal alcohol use • Increasing breastfeeding rates • Placing babies on their back to sleep
Childhood Health (ages 1-14)& Childhood Morbidity • Overall health is essential to each child’s optimal development • Failure to provide timely and remedial care leads to unnecessary illness, disability, and death – events that are associated with much greater costs than the timely care itself • Common causes of childhood morbidity * • Unintentional injuries • Maltreatment • Infectious diseases • Community Interventional Programs • Over 3 dozen program from 16 difference agencies • Maternal & Child Health Bureau • Block grant program, Health Start initiative, Emergency Medical services, the Abstinence Education Program
Adolescent, Young Adults & Adults * • Adolescent age after puberty but precedes age of majority - usually 15 to 17 years old • Young adults 18 to 24 years old • Adult 25 to 64 years old • Most productive years of life are ages 15 to 64 • Complete education, raise families, develop career • Understanding age group health risks & problems • Detect risks for specific priority populations • Propose specific risk-reduction programs
Adolescents & Young AdultsImportance & Demographics * • This stage in life can be the most difficult due to: • Increased freedom • Access to health-compromising substances & experiences • Lifestyle challenges • A critical stage in developing • Good health beliefs, attitudes & behavior • Number of Adolescents and Young Adults • Peaked at 21% in 1979 with baby boomers; in 2005 the number was just over 14%; approx. 66% were white • Living Arrangements • In 2005, 32% lived in single-parent homes; 66% of black children lived in single-parent homes • Employment Status • Has remained relatively constant since 1980
Adolescents & Young AdultsHealth Profile * • Mortality • Death rate declined • Threat comes primarily from behavioral activities • Higher rates in men • Causes of mortality • Unintentional injuries (mostly from vehicle crashes) & many include use of alcohol • Homicides - up from 1950 • Suicides - up from 1950 & higher in males
Adolescents & Young AdultsHealth Profile * • Morbidity • Communicable diseases: measles (serious for this reproductive age group & resurgence since late 1980s), STDs (most prevalent are chlamydia, gonorrhea) • Nearly half of STD infections in U.S. each year occur in this age group • Several STDs can be treated but not cured, e.g. hepatitis, HIV, HPV • Age group to most likely to have multiple sex partners & engage in unprotected sex
AdultsHealth Profile * • Mortality • 25-44 yrs. of age: unintentional injuries, cancer, heart disease, suicide, homicide, HIV • 45-64 yrs. of age: cancer, heart disease, unintentional injuries, diabetes, stroke, chronic lower respiratory disease (CLRD) • Cancer • #1 killer in this 25-44 yrs. of age group • Most prevalent types: lung, colorectal, breast • Screenings important to catch early • Cardiovascular Diseases • Death rates continue to drop • Drop has vaulted cancer to be #1 killer in 45-64 yrs. of age • Change due primarily to public health efforts aimed at decreasing smoking, increasing exercise & eating better
AdultsStrategies for Improving Health * • Primary prevention • Exercise & nutrition programs • Secondary prevention • Clinical screenings • Tertiary prevention • Medication compliance
Detection of Cognitive Impairment • Basic definitions * • Mental health • Psychological state of someone who is functioning at a satisfactory level of emotional & behavioral adjustment • Cognitive health • Not just dementia & Alzheimer's • Multi-dimensional status including fluid & crystallized intelligence, general memory & learning & “broad” ability of visual & auditory perception, retrieval, cognitive speediness & processing speed (NIMH)
Substance AbuseImportant Health Problem * • The age when adolescents first start using alcohol, tobacco and illicit drugs is a reliable predictor of later substance abuse problems • Especially if that use begins before age 15 • US Department of Justice, May 2001 report • By the 8th Grade (approximately 14 years old) • 52% have consumed alcohol • 41% have smoked cigarettes • 20% have used marijuana
Substance Abuse Problem in US * The #1 community health issue in America Substance abuse accounts for nearly $500 billion annual economic loss (treatment, lost productivity, etc.) Estimated over 500,000 deaths per year
Definition of terms • Drug • Substance when taken in small quantities alters a person’s physical, mental or emotional state • Other than food or vitamin/nutritional supplements • Psychoactive Drug • Alters sensory perceptions, mood, thought process or behavior • Drug misuse • Inappropriate use of prescription or non-prescription (OTC) drugs
Definition of terms * • Drug abuse • Using a drug for non medical reasons • Continued use of a legal drug with the knowledge that it is hazardous to one’s health (e.g. cigarette smoking) • Use of alcohol or nicotine by under-aged persons • Drug dependence • When one believes that a particular drug is necessary for normal functioning
Legal Drugs Abused • Alcohol * • The #1 drug problem in US as measured by injury, deaths, & economic costs • Bing drinking • Males 5 or more • Females 4 for more • 26% of underage drinkers abuse or are dependent • 75% of HS seniors have used alcohol
Legal Drugs Abused • Nicotine * • Found in all tobacco products • Cigarettes, cigars, smokeless or spit tobacco & pipe tobacco • Synar Amendment • Prohibits distribution of tobacco products to those under 18 yo • 23% of HS seniors smoke cigarettes daily • New low number • Smoking accounts for 438,000 deaths per year • Smoking accounts for a loss of $138 billion
Controlled Substances & Illegal Drugs * • Regulated by the Comprehensive Drug Abuse Control Act of 1970 (CDACA) • Schedule I • Drugs with high potential for abuse & no medical use • Heroin, MDMA, marijuana • Schedule II to V • Drugs that have medical use & are placed in categories based on potential of abuse & risk of causing dependence • Complete list at: http://www.justice.gov/dea/pubs/scheduling.html • Drug Enforcement Administration (DEA) • Responsible for enforcing CDACA
Prevention& Control of Drug Abuse * • Primary level • Aimed at those who have never used drugs • Prevent or forestall initiation of drug use • Education, increasing costs • Secondary level • Reach those who use but are not yet chronic drug abusers • Education • Workplace information • Tertiary level • Designed to provide drug abuse treatment & aftercare
Non-governmental Drug Prevention& Control Agencies and Programs • Community based drug education * • Six key features • Comprehensive strategy • Indirect approach to drug abuse prevention • Goal of empowering youth • Participatory approach • Culture sensitive orientation • Highly structured activities
Elders *Introduction • Overall American population is growing older • Number of elders in US increased dramatically in the 20th century • Age is and always will be a relative concept • Aged is the state of being old • Aging is the process of changes that occur as the living grow older
EldersStrata Definitions * • “Old” is > 65 • “Young old” is 65-74 • “Middle old” is 75-84 • “Old old” is > 85
Demography of Aging * • Other demographic variables: geographic distribution • Just over 50% live in only 10 states: CA, FL, IL, MI, NJ, NY, NC, OH, PA, TX • CA has the most in numbers • FL has greatest percentage of state population • Several Midwest states have small total number, but high percentage • Other demographic variables: economic status • In 1970, 25% of elderly lived in poverty, in 2004 it was 10% • Income sources - 39% Social Security, 25% earnings, 19% pensions, 14% assets, 2% misc.
Elderly Health Profile * • Mortality • In 2004, leading causes of death were heart disease, cancer, stroke, CLRD, & Alzheimer’s disease • Age-adjusted death rate continues to fall • Biggest increase in death rates has been in diabetes & CLRD • Morbidity • Chronic conditions - hypertension, arthritis, heart disease, diabetes, emphysema; substantial burden on health & economics; 34% of elders limited by a chronic condition • Impairments - deficit in function of one’s sense organs or limitations in one’s mobility or range of motion; four primary impairments: hearing, orthopedic, cataracts, & other visual
Elderly Health Profile * • Health behaviors & lifestyle choices • Report better health behaviors than younger people • Less likely to: consume large amounts of alcohol, smoke cigarettes, and be overweight & obese • Most important: diet, exercise & immunizations • Physical activity decreases with age; only 22.4% report regular physical activity • Elder abuse & neglect (between 1 & 2 million per year) • Females are abused at a higher rate than men • Elders > 80 years are abused or neglected at 2-3 times the rate of their proportion of the elderly • In 90% of abuse cases the perpetrator is a family member, 66% of the perpetrators are adult children or spouses, 50% by elder • Victims of self-neglect are usually depressed, confused, or extremely frail, vulnerable & unable to defend themself
Elderly Instrumental Needs * • Community Facilities & Services • Older Americans Act of 1965 (OAA) greatly improved services & facilities: nutrition program, State & Area Agencies on Aging, caregiver program • Meal service: Meals on Wheels & congregate meals • Homemaker service: enables elderly to remain in their own homes & live semi-independently • Chore & home maintenance service • Visitor service for homebound • Adult day care: provides care for seniors left alone all day • Respite care to allow caregivers some “time off” • Home health care: helps elders to continue to live at home • Senior centers: multipurpose facilities • Other services: specific to communities
Diversity & Health Advances in medical technology, lifestyle improvements, and environmental protections have all led to health gains Yet these changes have not produced equal benefit in some racial and ethnic populations This is the continuing challenge to public health professionals and the standard we must keep in mind when measuring our progress: what is the health status of the least empowered among us?” * (Centers for Disease Control and Prevention, 1997)
Community Health Strategies for Achieving Equity in Minority Health * • Cultural & Linguistic Competence • A set of congruent behaviors, attitudes, and policies that come together in a system, agency, or among professionals that enables effective work in cross-cultural situations • Ten principles related to cultural competence • Considered important when planning and implementing health promotion/disease prevention programs • These 10 are listed on next slide
Lesbian, Gay, Bisexual & TransgenderLGBT Health * • Unique health needs should be considered as part of public & community health • To improve overall health of every person • To eliminate health disparities • Medical information available from government agencies & non-profits • Such as the LGBT Medical Association
Mental HealthIntroduction * • Mental illness is the leading cause of disability in US, Canada & Western Europe • Mental illness is a major community health issue • 22–23% (44 million) of American adults affected • 6% have addictive behaviors • 3% have both mental & addictive disorders • Only 1/4 to 1/3 of those diagnosed receive treatment • 5 million adults in U.S. have serious mental illness • Number of those affected continues to rise & affects all ages • Significant resources are required to meeting the continuing demands for mental health care
Mental HealthDefinitions • Mental illness • Term that refers collectively to all diagnosable mental disorders (HHS, 1999) • Mental disorders • Health conditions characterized by alterations in thinking, mood, or behavior (or some combinations) associated with distress and/or impaired functioning (HHS, 1999) • Classification • Diagnostic & Statistical Manual of Mental Disorders, 4th edition, text revision (DSM-IV-TR) • Classify: onset age; severity (mild, moderate, severe)
Origins & Causes ofMental Disorders • Origin • Hereditary or environmental or both; idiopathic • Causes • Deficiency at birth (genetic, idiopathic, maternal exposure), physical impairment, psychological • 66% of mental retardation cases traceable to environmental factors * • No prenatal care, poor nutrition, dementia Alzheimer's type (DAT), postnatal exposure
Meeting the Needsof Mental Illness • Three Levels of Prevention * • Primary prevention • Efforts aimed at forestalling the onset of mental illness • Falls on voluntary agencies like the National Mental Health Association • Secondary prevention • Reducing the prevalence by shortening episodes • Provided by private clinics, CMHCs, ERs & various social service providers • Tertiary prevention • Treatment & rehabilitation to ameliorate the illness & prevent further problems for the individual & the community • Two basic treatment approaches - psychotherapy & psychopharmacology
Health Equity *For All Sub-populations • Health equity is achieve when every person • Has opportunity to attain full health potential • No one is disadvantage from achieving this potential • Due to social position • Any other socially determined circumstances • Health inequities are reflected in differences in • Length of life • Quality of life • Rates of disease, disability & death • Severity of disease • Access to treatment
Chronic DiseaseSurveillance Systems • Behavioral Risk Factor Surveillance System by CDC • State-based system of health surveys by telephone • Provides prevalence & trends data • Local area & statewide “quick views” • Chronic Disease Indicators • Nearly 100 indicators that allow states to uniformly define, collect & report chronic disease data • Health-Related Quality of Life • Perceived physical & mental health over time • Helps identify unmet population health needs • Recognize trends, disparities & determinants of health • Assists informed decision making & program evaluation for public & community health programs
Common Chronic Disease in US * Cancer Diabetes Arthritis Obesity Respiratory diseases Oral conditions Cardiovascular, heart disease & stroke
Basic Information AboutChronic Disease * • Arthritis is most common cause of disability • Nearly 19 million report activity limitations • Diabetes continues to be the leading cause of kidney failure for US adults (age 20 – 74) • Causes: • Non-traumatic lower extremity amputations • Blindness
Most Common Causes ofChronic Disease * Lack of physical activity Poor nutrition Tobacco use Excessive alcohol consumption Notice a common theme? All are modifiable health risk factors of behavior. Prevention is the key.
Chronic Stress • Psychoneuroimmunology research • Inter-connection of mental state, nervous & immune systems • Result is decreased function of immune system, impaired pituitary function (lower growth hormone) • Associated with alcoholism & child abuse • Increased levels of visceral fat storage • Stress is a prequel to anxiety * • Two types of anxiety • State – short term • Trait – long term
Anxiety Overview • Normal reaction to stress • Helps deal with a difficult situation with both fear & reward aspects • A protective psychological & physiological state • Anxiety results from insufficient coping skills • Characterized by • Somatic, emotional, cognitive & behavioral components • Normal reaction to stress • Helps deal with a difficult situation; both fear & reward • Related to uncontrollable or unavoidable situations • Fear is related to escape & avoidance only • Similar to stress HPA axis reaction, except amygdala, hippocampus & nucleus accumbens (reward center) also involved *
Definitions * • Overweight & obesity are similar but different issues • Overweight is weighing too much from muscle, bone fat and/or water • Obesity is specifically having too much body fat (adipose tissue) • Both terms mean that one’s weight is greater than what is considered healthy for one’s height • Both can cause similar health issues (Source: NIH & National Institute of Diabetes & Digestive & Kidney Disease)
Most Risk FactorsAre Modifiable * • Environment • Home – reduce time spent sedentary (TV) • Schools – lunch programs meet nutrition standards; daily physical education • Work – create or provide opportunities for physical activity at work sites • Community – promote 5 serving of fruits & vegetables; reasonable portion sizes; encourage food outlets to provide low-calorie options; provide physical activity opportunities (sidewalks)
Body Mass Index * • A crude population measure of obesity is body mass index (BMI) • BMI formula was developed by Belgium statistician Adolphe Quetelet (1796-1874) • Calculation methods • BMI = (weight in pounds/height in inches2) * 703 • Correlates with amount of body fat, does not directly measure fat • Overweight • BMI between 25.0 and 29.9 • Obesity • BMI 30 or higher
BMI Classifications * • < 18.5 = underweight • 18.5–24.9 = normal weight • 25.0–29.9 = overweight • 30.0–34.9 = class I obesity • 35.0–39.9 = class II obesity • ≥ 40.0 = class III obesity
Environment & Genetics* • America is “obesogenic” according to the CDC • We have environments that promote increased food intake, non-healthful foods & physical inactivity • Fat mass & obesity associated (FTO) gene has role in modulating energy balance • Complete role as yet unknown • Discovered & research since mid 2000s • Allele variant related to obesity • Influences control of food intake & food choices, but not a single control factor