Download
1 / 27
270 likes | 465 Views
MERIS US Workshop Vicarious Calibration Methods and Results. Steven Delwart. Presentation Overview. Recent results CNES methods Deserts, Sun Glint, Rayleigh Scattering Inter-sensor Uyuni MOBY-AAOT Vicarious Adjustment methodology Older results Dark Water SIMBADA Ocean

E N D
MERIS US Workshop Vicarious Calibration Methods and Results Steven Delwart
Presentation Overview Recent results • CNES methods Deserts, Sun Glint, Rayleigh Scattering • Inter-sensor Uyuni • MOBY-AAOT • Vicarious Adjustment methodology Older results • Dark Water • SIMBADA Ocean • Rail Road Valley Playa • Comparison with AATSR • Comparison with SCIAMACHY • Snow Targets
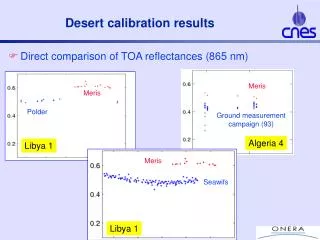
Calibration of MERIS using natural targets Deserts, Sun Glint, Rayleigh Scattering(Claire Tinel, Patrice Henry, Olivier Hagolle - CNES) Deserts Sun glint Rayleigh • These calibration methods are used operationally at CNES • for POLDER 1, 2, 3, VEGETATION 1 and 2, • for SPOT satellites, MERIS, FORMOSAT-2 and KOMPSAT-2
Definitions Meris on board calibration is the nominal calibration method Meris is calibrated against t.o.a. reflectance k: Spectral band DN : Digital Number (Meris Level 0, corrected for instrumental defects) : Reflectance Ak : Sensitivity of instrument for spectral band k Calibration results are expressed this way Calibration of MERIS using natural targets
Systematic collect of satellite acquisitions over the 20 sites :Operational monitoring of CNES sensors calibration (on a monthly basis) : SPOT(s)/High Resolution SPOT(s)/Vegetation-1&2 PARASOL Calibration monitoring and intercalibration of other sensors on a regular basis (through cooperation agreements with international space agencies) High resolution : Formosat-2 (Taiwan NSPO), Kompsat-2 (South Korea KARI) Medium resolution : MERIS (ESA), MODIS (soon to come) Archive of POLDER1&2, SeaWiFS, AVHRR, MISR, MODIS, ATSR2 data. Storage in a data base : SADE data base : “Structure d’Accueil de Données d’Etalonnage” (Calibration Data Repository) Easy data management Link between satellite measurements and calibration results (traceability) Nota : the SADE data base also includes calibration measurements over ocean, sun glint, clouds and snow covered sites. SADE Data Base
Compare two sensors : One sensor as reference Comparison at TOA level Sensor 2 Measurement Reference Sensor Surface reflectancefor reference sensor Comparison :ΔAk Spectral resampling Surface reflectancefor sensor 2 Simulated ToA reflectance for sensor 2 Desert CalibrationMethod TOA Atmospheric correctionto surface reflectance Atmospheric correctionto ToA reflectance SURFACE • Need to account for: • Directional effects • Atmospheric conditions • Spectral discrepancies
Atmospheric correction : Atmospheric correction performed using SMAC and meteo data : Rayleigh scattering correction Water vapour Ozone Other contributors : CO2, CO, NO2, CH4 (climatologies) Problem : aerosol correction… Aerosol optical thickness t =0.2 Statistically solved through the use of a lot of data: no significant bias, but dispersion for short wavelengths Desert CalibrationProcessing
POLDER Comparison 490 865 2002 2007 560 Cross-calibration with PARASOL as a function of time (20 sites) No significant variation with time 665
Observe the atmosphere over ocean (dark) Absolute calibration of bands < 700 nm Rayleigh scattering : > 80% of signal TOA reflectance well predicted using: Successive Orders of Scattering Smile effect correction Main error sources ocean surface reflectance : predicted using climatology derived from SeaWiFS (1998-1999) only over very stable oceanic zones (oligotrophic zones) aerosols : estimated using 865 nm band Only optical thickness < 0.1 are kept Accuracy : 4 to 5% (3) – 2 to 3 % (RMS) Rayleigh Calibration
Choice of oligotrophic areas with 2 years of SeaWiFS data made in 2001 with ACRI and LOV (CLIMZOO zones) Rayleigh Calibration Sites
Rayleigh Calibration Results No discrepancy greater than 2.5%
Sun glint calibration observe the white reflection of the sun over the ocean surface interband calibration w.r.t. a reference spectral band TOA reflectance predicted using SOS code Main error sources Reference band calibration errors ocean surface : SeaWiFS climatology aerosols : fixed model used (M98, AOT :0.08) daily SeaWiFS aerosol product used to discard cases when aerosol properties differ from reference model Accuracy : 3 to 4.5% (3) - 1.5 to 2% (RMS) Calibration of MERIS using natural targets
Comparison of sun glint results using different reference bands Sun Glint Calibration Results
Error bars correspond to standard deviation of results Sun glint Reference spectral band Rayleigh / Sun Glint Still no discrepancy greater than 2.5%
Conclusions MERIS instrument seems well calibrated Rayleigh + glint + deserts measurements agree with MERIS level 1 calibration (within 2 %) Very good agreement between Rayleigh and sun glint calibration methods no significant degradation with time thanks to : MERIS calibration device MERIS good spectral calibration Simultaneous validation of : MERIS calibration CNES calibration methods Perspective Multitemporal calibration monitoring of 412 and 443 nm bands MERIS/MODIS intercalibration over deserts Calibration of MERIS using natural targets
Inter-sensor at Uyuni Data Selection Criteria: Reciprocal and identical doublets are kept if from the same day or differing by one day Salar de Uyuni (Bolivia) Geometric selection criteria 10 deg > [ (SZA(i)- SZA(j))2+ (VZA(i)- VZA(j))2+ 1/4x(abs(RAA(i))- abs( RAA(j)))2] (Equvalent to a difference of 5 deg for VZA & SZA and ±10 for RAA.) 865nm AvrDif=0.38% STD=2.11% 560nm AvrDif=0.22% STD=2.64% Sensor Intercomparison MERIS, MODIS, AATSR, PARASOL MODIS vs MERIS Very good agreement
LISE AnalysisMoby, AAOT Good agreement in the blue, questionable in the NIR do to dominant backscattering geometry available from Moby.
Older Vicarious Results Older results • Dark Water • SIMBADA Ocean • Rail Road Valley Playa • Comparison with AATSR • Comparison with SCIAMACHY • Snow Targets
884 nm -2.2 % 864 nm -1.4 % 778 nm +0.9% 753nm +1.4% 680 nm -1.0% 664 nm -2.5% Dark Water (LISE)
SIMBADA (LOA) • 23 independant pixels from 14 scenes • AOT max : 0.15 • Within 3 hours from satellite overpass • Case 2 waters rejected
Rail Road Valley Playa Collaboration RSL & UofA
Rail Road Valley Playa Collaboration JPL & UofA
Comparison with SCIAMACHY • Given the current state of knowledge, we (KNMI) propose that it is the reflectance data of • SCIAMACHY instead of MERIS, that should be corrected.
Snow Targets Longyearbyne (ESA) Barrows (JAXA)