Download
1 / 39
400 likes | 544 Views
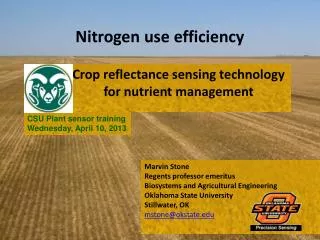
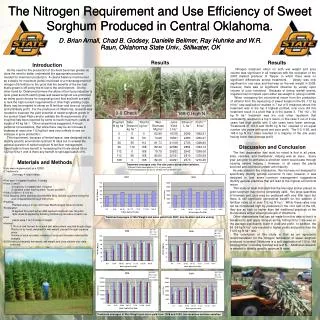
CANOPY REFLECTANCE (HRWW AND HRSW) IN SOUTH DAKOTA ECONOMIC OPTIMUM NITROGEN RATE FOR HRSW IN SOUTH DAKOTA. Nitrogen Use Efficiency Meeting Cheryl Reese*, David Clay*, Dwayne Beck*, John Lukuch ‡ , Tulsi Kharel *, Sharon Clay*, Dan Long † , and Gregg Carlson*

E N D
CANOPY REFLECTANCE (HRWW AND HRSW) IN SOUTH DAKOTAECONOMIC OPTIMUM NITROGEN RATE FOR HRSW IN SOUTH DAKOTA Nitrogen Use Efficiency Meeting Cheryl Reese*, David Clay*, Dwayne Beck*, John Lukuch‡, TulsiKharel*, Sharon Clay*, Dan Long†, and Gregg Carlson* *South Dakota State University, Brookings, SD ‡ North Dakota State University, Langdon, ND †USDA-ARS, Pendleton, OregonAugust 3rd, 2010Stillwater, Oklahoma
Objectives • Improve N fertilizer recommendations for South Dakota Wheat • Evaluate canopy reflectance to predict N • EONR and impact of protein premium / discount
Study Location Study Location
HRWW Study Locations Field Locations Winner, SD
Passive Sensor Depend on sunlight Trade-off: collect over wide range, ability to select wavelengths, and wavebands Remote Sensing Equipment: CropScan, Passive 16 Band Radiometer
Dakota Lakes, HRWW 2006:Good year for line source irrigation 05/11/06 • 04/26/06: • 3-4 leaf, tillering • 05/11/06: • Jointing • 05/26 • Boot, • Some awns visible 04/26/06
HRSW,Dakota Lakes,2003-2004Canopy Reflectance, Yield, and Protein
Field Cultural Practices • No-Till for 20+ years • Wide variety of rotations • Beneficial soil / mycorrhyzial interactions • Average spring soil test NO3 • 60 kg-N ha-1 • Previous crop • 2003: Soybeans • 2004: Pinto beans and cowpeas
Growth Stages • May 15th • 3-4 leaf, tillering • June 4th • 6 leaf, end of tillering • June 14th • Flag leaf, some awns • June 26th • Flowering
Results Which would you select? NDVIw NDVIn GNDVIn CRedEdge 15
NDVI in SD, HRSW Monitor growth stage carefully, Collect NDVI before canopy closure to avoid saturation issues Around Memorial Day Weekend (End of May, Beginning of June)
Summary: HRSW • NDVI values should be collected before 5-6 leaf on HRSW (~May 28th or Memorial Day in South Dakota). • If N is to be applied after 5-6 leaf, CRedEdge appeared to be a • This study suggests when soil NO3-N is ~60 kg-N ha-1, 130 kg-N ha-1applied 5-6 leaf increases yield, grain protein, and reduces lodging.
How Much N Fertilizer to Apply on HRSW?What Pays?What Does Not Pay?
What Farmers Know at Planting • N Fertilizer Cost • In SD, with HRSW, some indication of yield and quality in Kansas, Oklahoma, Texas • When they have lost $in the past due to discount on low protein wheat • When they have made $ with a premium • Fertilize for protein @ 12% HRWW, @ 14% HRSW
Study Locations Field Locations
HRSW grain market value in SD based on protein premium or discount.
South Dakota, July 30th, 2010 Commodity Prices & Premium/Discount
Experimental Design • RCB Design, Each Site, 4 Blocks. • N Treatments: Determined Apparent Return and EONR
Calculating Return on N InvestmentApparent Return ($ ha-1) • Two grain selling price • $129 or $258 Mg-1 ($3.50 or 7.00 bushel-1) • Three N fertilizer costs • $0.62, $1.25, or $1.90 kg-N-1 or • ($0.28, $0.57, or $0.86 lb-N-1) • Six Protein Premium / Discount Scenarios • N applied Pre-Emergence or In-Season
Results: Apparent Return, and Economic Optimum N Rate(EONR),Yield, and Protein
Nitrogen Treatment Impact for Different Protein Premium / Discount Scenarios onApparent Return ($ ha-1)
EONR: Application TimePre-Emergence or In-Season? • Tested 36 scenarios: • Six Sites • Three fertilizer prices • Two grain selling prices • Out of these: • EONR In-S or Pre-emergence the same: 22 scenarios • In-S EONR Higher: 10 • Pre-emergence EONR Higher: 4
EONR at Langdon and Rainfall • $129 Mg-1
Need Rain for in-season N
Conclusions • Indices show great promise in SD to manage in-season N for both HRWW and HRSW; need more fields. • N fertilizer price affects wheat EONR. • Development of a online EONR prediction model for wheat incorporating: • N fertilizer cost options • Value of grain • Different protein premium/discounts scenarios • Tillage / Climate Impacts on N mineralization: • Microorganism competition for N • Mycorrhizal colonization and contributions
Scientists: David Clay (SDSU) Sharon Clay (SDSU) Dwayne Beck (SDSU) Gregg Carlson (SDSU) Dan Long (USDA-ARS) Farmers and Support Staff at SDSU Dan Forgey (Farmer) Ralph Holzwarth (Farmer) Ryan Patterson (Farmer) Steph Hansen (SDSU) Jon Kleinjan (SDSU) Ryan Brunner (SDSU) TulsiKharel (SDSU) South Dakota State University Questions / Thank you! 36
Winner Field, 2006:A Challenging Field 05/26/2006