Download
1 / 53
530 likes | 711 Views
Navy Modeling Activities. Presented by Erick Rogers “Ocean Dynamics and Prediction” Branch of the Oceanography Division of the Naval Research Laboratory. Forecasting Systems. Fleet Numerical (official forecasts) Naval Oceanographic Office (official)

E N D
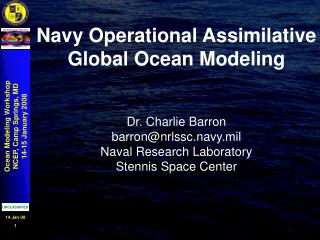
Navy Modeling Activities Presented by Erick Rogers “Ocean Dynamics and Prediction” Branch of the Oceanography Division of the Naval Research Laboratory
Forecasting Systems • Fleet Numerical (official forecasts) • Naval Oceanographic Office (official) • Naval Research Laboratory (technology demonstrations, realtime but pre-operational products)
FNMOC (Fleet Numerical Meteorology and Oceanography Center) (Monterey, CA) Example FNMOC web page FNMOC wave models: limited to global and regional
FNMOC wave products Example FNMOC product (output from global model)
FNMOC wave products Example FNMOC web page (output from one regional model)
FNMOC wave products Example FNMOC product (output from one regional model)
FNMOC meteorological products Example FNMOC product (surface winds from one regional model)
NAVO (Naval Oceanographic Office) Example NAVO web page and graphic from a sub-regional application (SWAN) NAVO wave models: (officially) limited to sub-regional and coastal applications
The Naval Research Laboratory • Navy’s corporate laboratory • Three campuses: • Washington DC • Stennis Space Center, MS • Monterey, CA • Basic (6.1) through applied (6.2) research, technology transfer (6.4), technology demonstration • Primary funding from ONR • Compete internally for block funding from ONR (very competitive) • Make up remainder with funding from SPAWAR (6.4) or direct proposals to ONR programs (also very competitive)
Circulation modeling at NRL Example NRL realtime circulation model webpage (Global NCOM)
Circulation modeling at NRL • Example NRL realtime circulation model graphics (Global NCOM). Potential uses: • search and rescue • spill mitigation
NRL Oceanography Division, Waves Group Richard A. Allard (6.4) – Transitions of technologies to operations; rapidly relocatable modeling systems; head of coastal oceanographic modeling Section James D. Dykes (6.4) – Transitions; Forecast system development; Delft3d implementation/validation; hindcasting; parallel computing; meteorological modeling Kacey L. Edwards (6.1, 6.2) – Phase-resolved modeling; Nearshore breaking and nonlinear interactions Y. Larry Hsu (6.4) – Transitions; Delft3d implementations; Navy Standard Surf Model; Lagrangian swell modeling; model validation Paul Hwang (6.1) – Physical Oceanography; basic processes theoretical research; gravity-capillary waves; air-sea interaction; airborne remote sensing of waves James M. Kaihatu (6.1, 6.2) – Phase-resolved model development; nearshore breaking and nonlinear interactions; data assimilation; wave-induced circulation; AUVs W. Erick Rogers (6.2, 6.4) – Phase-averaged model development/validation; global, regional, sub-regional applications; remote sensing applications; forecasting systems Jay Veeramony (6.1, 6.2) – Phase-resolved model development; turbulence and vorticity; nonlinear interactions; surf zone processes; nearshore wave breaking David Wang (6.1) – Physical Oceanography; ship-borne experiments; data processing; basic processes research; sea-swell separation; extreme waves; wavelet and HHT
NRL Oceanography Division, Waves Group: Model Suite • Global, regional wave applications • WAVEWATCH-III • WAM (phasing out) • Subregional, coastal wave applications • SWAN • STWAVE (phasing out) • Wave-induced circulation • Delft3D • 1D Surf Model (phasing out) • Research codes • REF/DIF1, REF/DIF-S, REF/DIF-SNL • Boussinesq models (time-domain and frequency domain)
Coastal Storms Program (CSP) (Sponsor: NOAA) NRL Washington/Oregon Wave Forecasting System http://www7320.nrlssc.navy.mil/CNW/ Example forecast: 1200 UTC June 17 2005
CSP Wave forecasting system WA/OR system is one of three systems created by NRL for NOAA. (Support to NRL ~30k/yr) 2D Graphics: Wave height, mean direction, wind speed, direction Forcing from NCEP regional model
CSP Wave forecasting system • 6 Computational Grids for the WA/OR System: • 1 outer grid • 1 shelf grid • 3 3rd level nest • 1 4th level nest
CSP Wave forecasting system Example 2D Graphic • Mouseover to view • prior analyses • present analysis • forecasts
CSP Wave forecasting system Wave forecasts for the Columbia River nest include water level and current forcing provided by the Oregon Graduate Institute (available as experimental product on ftp site)
CSP Wave forecasting system Example current forcing for experimental Col. R. nest
Climatologies (Jim Dykes) From global climatology database
Example of research and model development: Wave Propagation Over Viscous Muds Cassino Beach, Brazil Formula describing wave attenuation by viscous mud layer has been implemented and tested in SWAN wave model. (Validation forthcoming) Less mud, more breaking More mud, less breaking Collaborators: Alexandru Sheremet, Louisiana State University Jim Kaihatu, Erick Rogers, NRL-Stennis
Investigations of Wave Model Error, first example Spectrum from WW3 (NW location) This component not measured by nearby CDIP buoy shown here CDIP buoy (NW location) Spectrum from WW3 (SW location, used to force SWAN) Spurious swell from southwest exists in the boundary forcing from WW3 ENP model Spurious swell component exists here also Oct 22 – Nov 8: study of swell forcing
Advanced validation of wave models: validation of directional spreading Model uses DIA, but spreading is not overpredicted in the mean
QuikSCAT data within ±6 hours of analysis time Utilizing remote sensing to determine source of model error Gaps filled in by blending with operational NOGAPS analyses Wind analysis for Jan. 21. 1500Z, 2003
; Jan. 11, 2003, 1200 UTC Wave Analyses for Jan. 11, 2003, 1200 UTC Utilizing remote sensing to determine source of model error
Winter 2001/2002 Utilizing remote sensing to determine source of model error
Equal resolution (xy=200m) BSBT =0.74 SORDUP =0.31 SL1 =0.25 Equivalent computation time BSBT (xy = 100 m) =0.55 SORDUP (xy = 100m ) =0.26 SL1 (xy = 400 m ) =0.42 SWAN error comparison at gage 10 (= normalized rms error)baseline: REF/DIF model (no diffusion) =0.17 Investigations of Wave Model Error, second example is a measure of relative error
Hm0 (m) Evaluation of SWAN and WAVEWATCH3 for Hurricane Ivan (this is WW3)
6.2 ONR / 6.4 SPAWAR Project Title: Development of an AUV-Fed Nearshore Nowcasting System Objective: Develop a nowcasting system for nearshore waves and circulation which combines bathymetry melded from various sources (including on-scene UUVs) with a nearshore modeling system forced by an integrated ocean prediction system • Approach: • Evaluate Delft3D nearshore modeling system and integrate it with forcing from • DIOPS regional modeling system • Develop standalone implementation of modeling system which allows local • observations to be input as forcing for real time nowcast • Develop methodologies to meld UUV bathymetry with historical data and provide • estimate of error • Co-investigators: • Jim Kaihatu, Richard Allard, Todd Holland (7440), Brian Bourgeois (7440)
6.2 ONR / 6.4 SPAWAR Project Title: Development of an AUV-Fed Nearshore Nowcasting System Application to CJTFEX 2004 Delft3D forecast waves and currents every 6 hours 0.7m Sig. Wave Ht. http://www7320.nrlssc.navy.mil/CJTFEX/CJTFEX_2004.html • DIOPS SWAN forcing Delft3D • Delft3D set up in UUV operating areas 1kt U,V Bathymetry updated with UUV measurements
Generational Improvement in Operational Forecasting Capability • Previous nearshore operational capability: Navy Standard Surf Model • One-dimensional • Overly constrained: breaking waves longshore currents • Delft3D system now embedded at Mission Support Center • Communicates with DIOPS • MSC scientists trained on DIOPS and Delft3D
Example Development/Validation Project: Random Wave Forcing of Nearshore Circulation Validation of the REFDIFS-SHORECIRC combination at Duck94. Top panel is the model-predicted magnitude of the cross-shore velocity.[red is shoreward (to the left), blue is seaward (to the right)] Bottom panel is the velocity profile of the current (solid lines) compared to measurements (+).