Download
1 / 18
210 likes | 513 Views
Nested Designs. Ex 1--Compare 4 states’ low-level radioactive hospital waste A: State B: Hospital Rep: Daily waste. Nested Designs. Ex 2--Compare tobacco yield/acre in 5 counties A: County B: Farm Rep: Field Yield/acre Other Ex--Tick study, Classroom studies

E N D
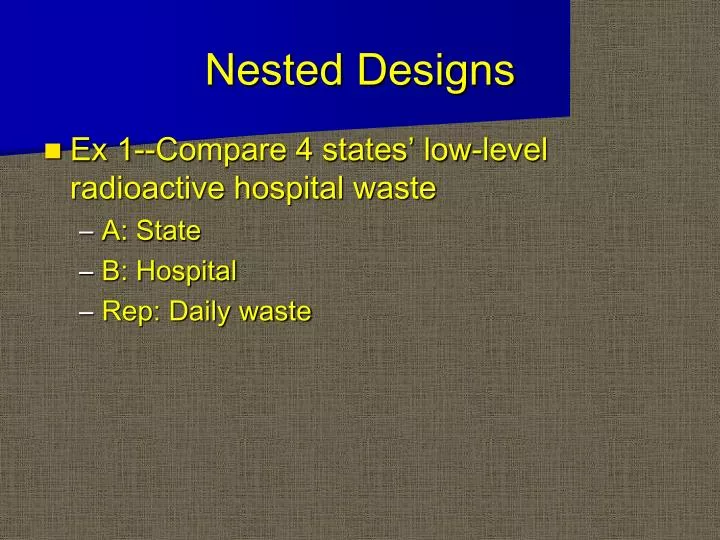
Nested Designs • Ex 1--Compare 4 states’ low-level radioactive hospital waste • A: State • B: Hospital • Rep: Daily waste
Nested Designs • Ex 2--Compare tobacco yield/acre in 5 counties • A: County • B: Farm • Rep: Field Yield/acre • Other Ex--Tick study, Classroom studies • Are A and B crossed in these studies?
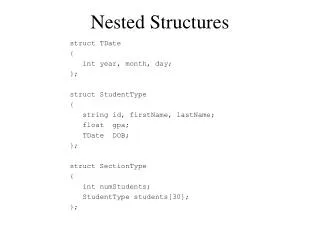
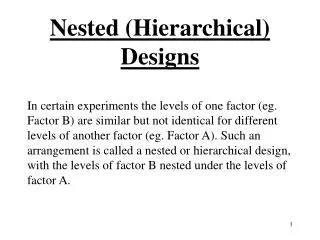
Nested Designs • We say B is nested in A when levels of B are unique (or intrinsic) to a given level of A • Nested designs can also be thought of as incomplete factorial designs (with most treatment combinations impossible)
Nested Designs • Typically, A is fixed and B is random
Nested Designs • We can decompose the sum of squares: SSTO=SSA+SSB(A)+SSE • Note that SSB(A)=SSB+SSAB
Expected Mean Squares • All other assumptions being satisfied for an F-test, we can compute Expected Mean Squares (EMS) to construct appropriate F-tests for factor effects
ANOVA table SourcedfSSEMS A a-1 SSA B(A) a(b-1) SSB(A) Error ab(n-1) SSE s2 Total abn-1 SSTO
Example • Tobacco Case Study • SAS code • Minitab • Variance Components
Cost Analysis • Supposed we want to minimize the variance of our treatment means (for a balanced design) • This will depend on the cost of sampling another level of the nested factor vs the cost of adding a replication
Cost analysis • The total number of units to be sampled is fixed at bn. If cost isn’t a factor, how should these units be allocated?
Cost Analysis • Assume we have a fixed project cost C • D1=“dollars” per nested factor level • D2=“dollars” per rep • Total cost C=b D1+bn D2
Cost Analysis • Subject to the cost constraint, we minimize • The answer turns out to be
Power Analysis • Note that increasing n does not really improve power for testing treatment effects