Download
1 / 41
520 likes | 1k Views
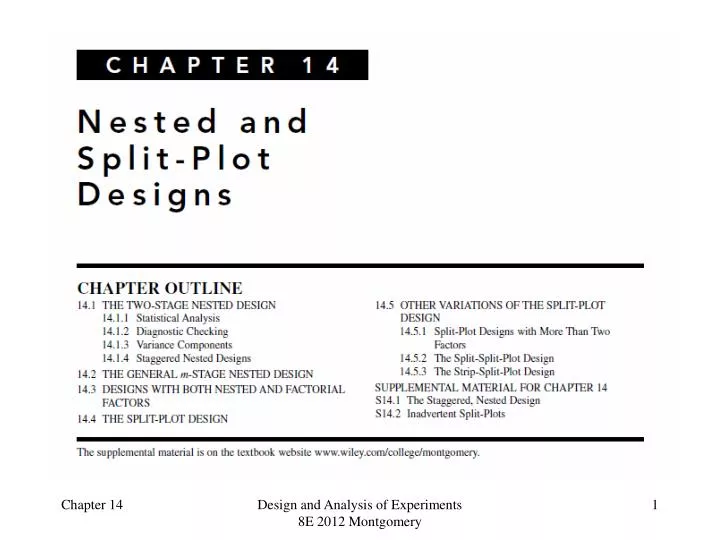
Design of Engineering Experiments – Nested and Split-Plot Designs. Text reference, Chapter 14 These are multifactor experiments that have some important industrial applications

E N D
Design of Engineering Experiments – Nested and Split-Plot Designs • Text reference, Chapter 14 • These are multifactor experiments that have some important industrial applications • Nested and split-plot designs frequently involve one or more random factors, so the methodology of Chapter 13 (expected mean squares, variance components) is important • There are many variations of these designs – we consider only some basic situations Design and Analysis of Experiments 8E 2012 Montgomery
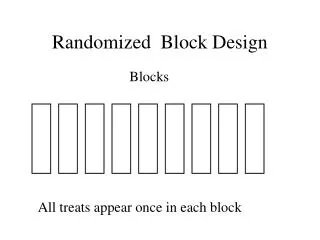
Two-Stage Nested Design • Section 14.1 • In a nested design, the levels of one factor (B) is similar to but not identical to each other at different levels of another factor (A) • Consider a company that purchases material from three suppliers • The material comes in batches • Is the purity of the material uniform? • Experimental design • Select four batches at random from each supplier • Make three purity determinations from each batch Design and Analysis of Experiments 8E 2012 Montgomery
Two-Stage Nested Design Design and Analysis of Experiments 8E 2012 Montgomery
Two-Stage Nested DesignStatistical Model and ANOVA Design and Analysis of Experiments 8E 2012 Montgomery
Two-Stage Nested DesignExample 14.1 Three suppliers, four batches (selected randomly) from each supplier, three samples of material taken (at random) from each batch Experiment and data, Table 14.3 Data is coded JMP and Minitab balanced ANOVA will analyze nested designs Mixed model, assume restricted form Design and Analysis of Experiments 8E 2012 Montgomery
Minitab Analysis Design and Analysis of Experiments 8E 2012 Montgomery
JMP Analysis (REML estimates of variance components) Design and Analysis of Experiments 8E 2012 Montgomery
Practical Interpretation – Example 14.1 • There is no difference in purity among suppliers, but significant difference in purity among batches (within suppliers) • What are the practical implications of this conclusion? • Examine residual plots – plot of residuals versus supplier is very important (why?) • What if we had incorrectly analyzed this experiment as a factorial? (see Table 14.5) • Estimation of variance components (ANOVA method) Design and Analysis of Experiments 8E 2012 Montgomery
Variations of the Nested Design • Staggered nested designs • Prevents too many degrees of freedom from building up at lower levels • Can be analyzed in JMP or Minitab (General Linear Model) – see the supplemental text material for an example • Several levels of nesting • The alloy formulation example • This experiment has three stages of nesting • Experiments with both nested and “crossed” or factorial factors Design and Analysis of Experiments 8E 2012 Montgomery
Example 14.2 Nested and Factorial Factors Design and Analysis of Experiments 8E 2012 Montgomery
Example 14.2 – Expected Mean Squares Assume that fixtures and layouts are fixed, operators are random – gives a mixed model (use restricted form) Design and Analysis of Experiments 8E 2012 Montgomery
Example 14.2 – Minitab Analysis Design and Analysis of Experiments 8E 2012 Montgomery
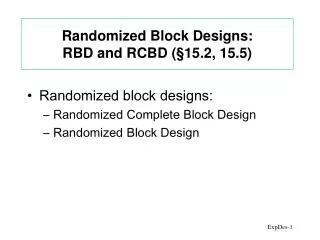
The Split-Plot Design • Text reference, Section 14.4 page 621 • The split-plot is a multifactor experiment where it is not possible to completely randomize the order of the runs • Example – paper manufacturing • Three pulp preparation methods • Four different temperatures • Each replicate requires 12 runs • The experimenters want to use three replicates • How many batches of pulp are required? Design and Analysis of Experiments 8E 2012 Montgomery
The Split-Plot Design • Pulp preparation methods is a hard-to-change factor • Consider an alternate experimental design: • In replicate 1, select a pulp preparation method, prepare a batch • Divide the batch into four sections or samples, and assign one of the temperature levels to each • Repeat for each pulp preparation method • Conduct replicates 2 and 3 similarly Design and Analysis of Experiments 8E 2012 Montgomery
The Split-Plot Design • Each replicate (sometimes called blocks) has been divided into three parts, called the whole plots • Pulp preparation methods is the whole plot treatment • Each whole plot has been divided into four subplots or split-plots • Temperature is the subplot treatment • Generally, the hard-to-change factor is assigned to the whole plots • This design requires only 9 batches of pulp (assuming three replicates) Design and Analysis of Experiments 8E 2012 Montgomery
The Split-Plot DesignModel and Statistical Analysis There are two error structures; the whole-plot error and the subplot error Design and Analysis of Experiments 8E 2012 Montgomery
Split-Plot ANOVA Calculations follow a three-factor ANOVA with one replicate Note the two different errorstructures; whole plot and subplot Design and Analysis of Experiments 8E 2012 Montgomery
Alternate Model for the Split-Plot Design and Analysis of Experiments 8E 2012 Montgomery
“Inadvertent” Split-Plot and CRD Analysis Design and Analysis of Experiments 8E 2012 Montgomery
Variations of the basic split-plot design More than two factors – see page 627 A & B (gas flow & temperature) are hard to change; C & D (time and wafer position) are easy to change. Design and Analysis of Experiments 8E 2012 Montgomery
Unreplicated designs and fractional factorial design in a split-plot framework Design and Analysis of Experiments 8E 2012 Montgomery
A split-split-plot design • Two randomization restrictions present within each replicate Design and Analysis of Experiments 8E 2012 Montgomery
The strip-split-plot design The “strips” are just another set of whole plots Design and Analysis of Experiments 8E 2012 Montgomery