Download
1 / 28
280 likes | 467 Views
The Genome Browser allows you to Browse the Rice-Japonica, Maize and Arabidopsis genomes. View the location of a particular feature on the rice genome and examine neighboring features. View the gene model of a candidate gene.

E N D
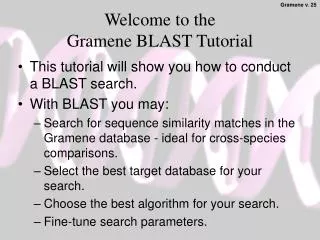
The Genome Browser allows you to • Browse the Rice-Japonica, Maize and Arabidopsis genomes. • View the location of a particular feature on the rice genome and examine neighboring features. • View the gene model of a candidate gene. • Identify the genomic sequence to which a particular feature is mapped. • Compare the position of features from other species with the location of features in the rice genome. • Get sequence information, including base pairs, codons and exons • This tutorial will show you how to: • Search for genes and other features in the Gramene genome browser. • Change the size and detail of a region. • Select which tracks to view. • Export information as text files. August 2005 v.20 Welcome to the Gramene Genome Browser Tutorial
Genome Browser Genome browser is a dynamic (interactive) graphical display of multiple features identified from rice as well as from maize, sorghum, barley, wheat and other cereals that were mapped on the rice genome. Examples of these features are sequenced genetic markers, ESTs, cDNAs, CDSs, genes, insertion and repeat elements. The browser is an option for investigating the organization of rice and other cereal genomes and lets you determine which features to view. The software application was developed by the Ensembl project (www.ensembl.org) and modified by the Gramene project.
Tutorial Help The hand icon indicates a link that allows you to go to the same page in your web browser. If you are viewing this tutorial with Adobe Acrobat Reader, click the "bookmarks" on the left hand side of the Reader for easier navigation. Action Options are noted in this type of font. Notes or comments use this style font.
Gramene Home Page Click here to open Genome Browser Home Page
Genomes Home Page 1. Type in the search term(a clone/feature’s accession number or name) and press “Lookup.” Version of TIGR being used RbcS 1b. If desired, you may narrow your search Click for BLAST tool. See BLAST tutorial. Or Click to read release notes for the current version of Genome Browser 2: Choose species from available genomes (see Slide 7 for Rice). Click to enter Gramene Mart.See Gramene Mart Tutorial
Option 1:Term Search Results The default search is for Rice, but you may select a different species. There are no results for these options. When there are results, note that you may be taken to a different module, and will need to refer to that specific tutorial There is not yet a definitive gene list for Oryza, so you have to wade through multiple potential protein matches and make educated choices.
Option 2 –Browse a Chromosome You may enter a chromosome number and location. Or you may select a chromosome to browse by clicking on it (see Slide 9). Or choose a Synteny map to view (see Slide 8)
Identifies the rice chromosome you are browsing, which is in the center of the diagram. 2a. Synteny: Rice Chr. 1 vs Maize Identifies the maize genomes you are comparing to the rice chromosome. Color-coding identifies the correlations. Those on the left show blocks of conserved synteny, those on the right show homology between genes. Navigation for choosing an alternate chromosome or syntenic species Clicking on a link on the map will let you view either the rice or the maize chromosome at that location (see Slide 11), or to display the Maize Chromosome centrally (example slide 26).
2b.Rice Chromosome 11 Choose another chromosome to view. Click on a band to go to contig view or jump to a contig view (see Slide 11) Chromosome information MapView shows distribution of features at chromosome scales. Click to select a region based on two features (Anchor view). (see slide 10). Click to choose viewing specific features (see slide 10). Select a species and click go to view synteny with current chromosome (see slide 8).
2b. Anchor and Karyo Views Use Anchor view, to select a region by two features. Use Karyoview to design your own map. Choose features (following directions at left). Upload data Configure results display
Viewing Results - Contig View This is an outline of information in ‘contig view’. These sections may display data when you come here. # Customizing and Navigation bar for detailed view (see slide 13 on customizing your view) Notice 4 categories (in blue), each with [+] or [-] to expand or collapse that section. (All sections have been collapsed for demonstration purposes.)
Chromosome Identifies which chromosome you are viewing Clicking on the chromosome will move view to that area Area in red outlined box on Chromosome is the area you are viewing and is enlarged to fill the overview below. Entire Chromosome is displayed above
Overview Red outlined box on Chromosome above fills this overview display. The area in the red box is enlarged to fill the basepair display below. Region of rice/maize synteny. Clicking on this section will magnify and center to the section you clicked on. Color-coded features are identified in left-hand column as indicated Boxes represent annotated TIGR genes
Customize your detailed view display by selecting and deselecting options. Selections will be saved for future visits. Zoom in/out to a desired level of resolution Navigating and Customizing the Detail View Arrays Changes display size. Features Navigation, use to export data. GSSs Decorations Navigation, use to go to different view. Select options to customize the view. Closing menus will refresh your map Export Jump To FSTs ESTs Navigation - Adjust your view by entering coordinates, then refresh Width Markers
Customization Pop-up menu • For this tutorial, the “popup on click” and “show popup menus” have been selected from the “decorations” options. Clicking on a feature will open a menu option. You may get different results if you have different selections. • If you deselect the “popup on click,” hovering over a feature will reveal the popup menu. • If neither option is selected, clicking on a feature will take you to an appropriate page with more information on that particular feature.
Customize view to choose options (previous 2 slides) Detailed View Features above the sequence (clone) are on the forward strand Features Features below the sequence (clone) are on the reverse strand Click on a feature to open menu options (see slides 18-24) Red outlined box on overview above fills this detailed view display. The area in the red box is enlarged to fill the basepair display below. (You may wish to center in on a coding region.) The “+” or “-” sign will tell you if the track is expanded or collapsed. Click on track name to navigate to help file on that term.
Base Pair View Click for more information on tracks. Each sequence has three different possible codon (amino acid) sequences, which are displayed here. For example TTGTCTTCCTCA can be viewed in any of the following three ways: TTG TCT TCC TCA …TT GTC TTC CTC A.. …T TGT CTT CCT CA… Click length ruler to open zoom menu
Describes location on the Rice genome. Select to view detailed info from the Genome Browser. In detail view, click on a feature to open this menu (see slide 19). (see slide 20). Note : slides 18 through 23 are interconnected, and many of the links on one leads to another. Detailed information on the transcript and its structure (see slides 21, 22 and 23.) Select to view Ensembl Protein Report (See Slide 22).
Transcript Information Exon – coding sequence Intron – non-coding sequence Deduced protein sequence with the corresponding gene sequence Legend with color-coded details of the Transcript. Alternating colors are alternate exons. Select a different view.
Exon Information Exon sequences in Black
Protein Information Links provide detailed information on the corresponding Gene, Transcript and Exons Allows you to export data in various formats.
Export View Click the Export menu. Select the image format options. Choose FASTA for sequence, Flat File for annotations & other features.
Adjust Export Options Choose file format. Select features to include in export. Choose “Text” for download, “HTML” for web-display, “Zip” for compression. 13e: Click Export when ready.
Exported File The data you export will look something like this… FASTA Flat File
Contact Gramene Use the feedback button, located at the top of every page, to provide feedback or to ask questions about Gramene. or Email Gramene at gramene@gramene.org