Download
1 / 24
240 likes | 385 Views
How to Drive Performance in Homelessness Prevention Programs NAEH Conference, 2/22/13. Homelessness Prevention Context. Employment & Training. Work Supports. TANF Cash Grant. Diversion at Intake. Eviction Prevention. Homebase Prevents Shelter Entry:

E N D
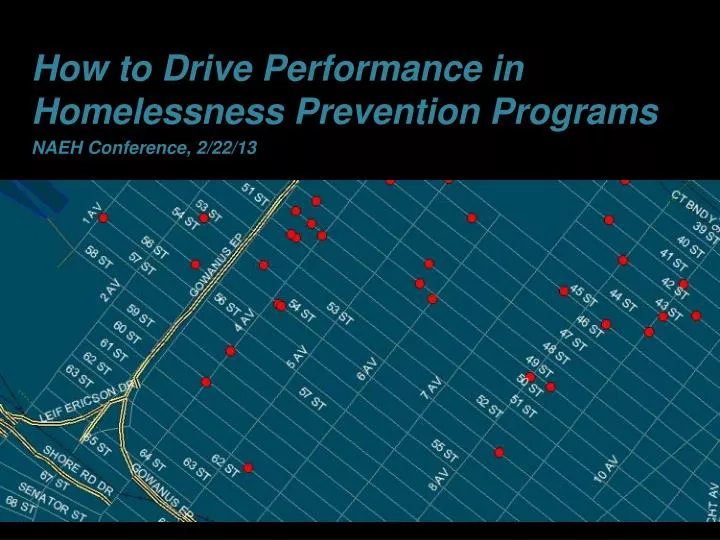
How to Drive Performance in Homelessness Prevention Programs • NAEH Conference, 2/22/13
Homelessness Prevention Context Employment & Training Work Supports TANF Cash Grant Diversion at Intake Eviction Prevention
Homebase Prevents Shelter Entry: • Finding the most at risk in the community • Serving the hardest to serve • and provide brief services to thousands more.
Program Model • DHS partners with 8 non-profit organizations to run 11 Homebase programs in the highest need communities. • Services include: • Family and landlord mediation • Budgeting and financial counseling • Entitlements advocacy • Employment and training • Legal advice and referral • Short-term financial assistance
Research from 2012* showed that during the period from November 2004 through November 2008: Homebase reduced shelter population. By between 10 and 20 families per 100 HB cases. By around 15 families per 100 HB cases. *Can Homelessness Be Prevented? Evidence from New York City’s Homebase Program, Brendan O’Flaherty, Peter Messeri, and Sarina Goodman
This year, Homebase will use the assessment to serve 5,000 high risk families and provide brief services to thousands more. • This year, you are going to use the assessment to serve 5,000 high risk families and provide brief services to thousands more.
PreventionStat: • Assessing Individual Risk • Neighborhood • Targeting • Enrollment • Client Outcomes
How do we target services? New Yorkers are below the poverty line: 1,000,000 According to Census data, at least 13% of all American households are doubled up—that would be 950,000 households in NYC The TANF cash assistance caseload is 355,000 households Over 120,000 eviction warrants issued each year in NYC Less than 20,000households become homeless each year
What makes a household high risk for shelter entry and can Homebase target services to these high risk individuals?* DHS provided a database of 11,105 Homebase families who applied for services between Oct 1, 2004 and June 30, 2008 Analyzed intake and program eligibility data for families with children DHS provided administrative data on shelter entry over the next 3 years *Efficient Targeting of Homelessness Prevention Services for Families, Marybeth Shinn and Andrew Greer, 2012
The short screener can predict likelihood of shelter entry more accurately than current decisions Prediction is hard: Even at the highest levels of risk, most families avoid shelter. Workers should be able to override the recommendation of the model with written explanations The higher the risk score, the more success at preventing shelter entry.
Applicant Assessment Scores 8,700 assessments 7/1/12 -12/31/12, 25 Point scale
Neighborhood Mapping Sample CD 303 Map
Enrollments by Provider 4,544 enrollments, July 1 – December 31 2012
Service Provision • The hardest to serve…are the hardest to serve • Individualized plans • Partnership agreement—with flexibility • Doubled-up households as a housing option • Have to be willing to adjust your effectiveness goal—100% retention is fishy • Effective prevention services do not have to include financial assistance, at least right away • Focus vast majority of resources on highest risk cases, but also create low resource, light touch services
Service Provision • “Brief” service model: Offer a range of services that are progressively more intensive and expensive only after initial interventions doesn’t work • Workshops • Housing advice • Financial empowerment • Meaningful referrals
Next Steps Continually study and improve assessment tool Release cost-benefit study